Ethereum massive H&S pattern update
Hey guys,
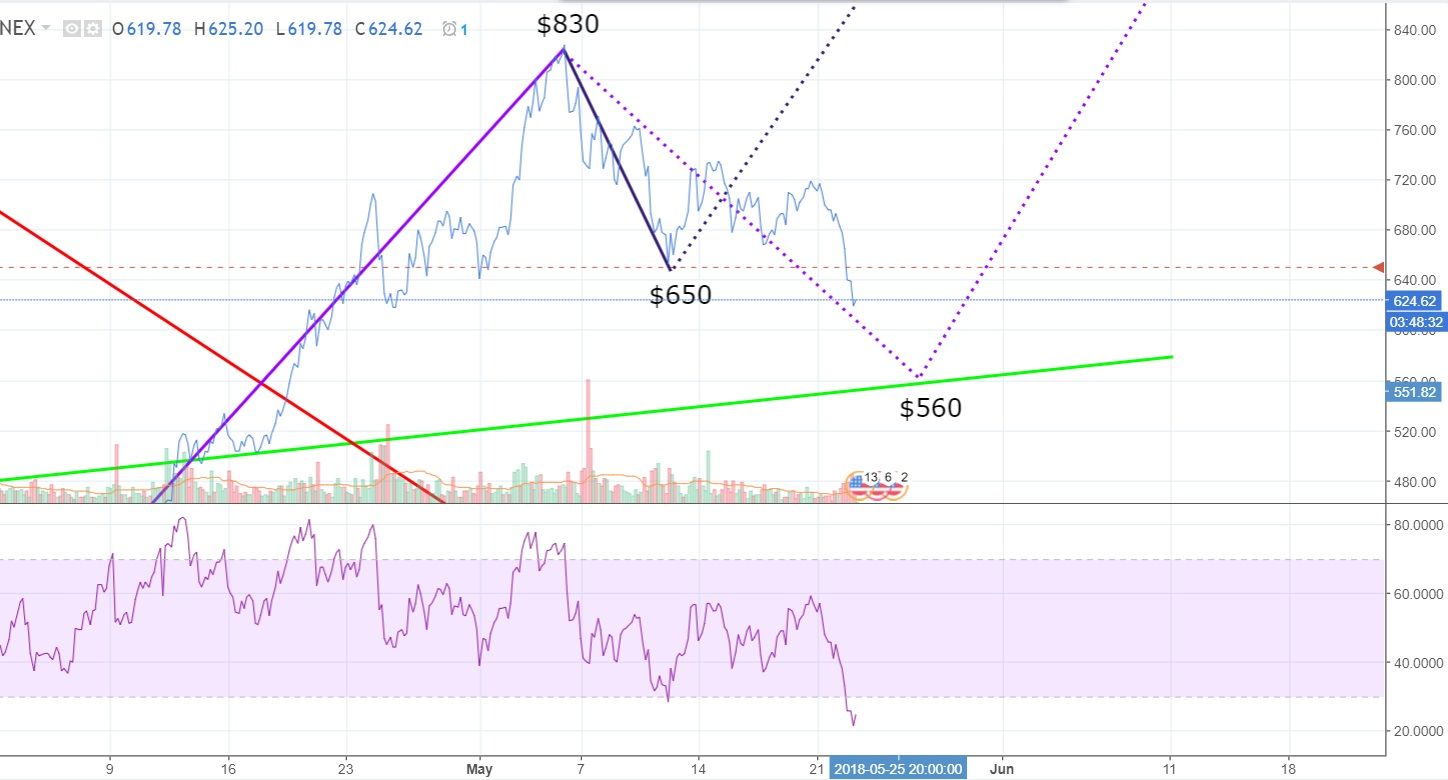
As you may have seen already that the crypto market has fallen across the board today. So I'm doing an update on ETH. Looking at the current situation the falling wedge pattern has been invalidated and I've now removed that on the chart. If you have been following my previous posts you'll know that I've mentioned that the top of the right shoulder may have already formed at $830 and it doesn't have to reach the $950 area. But I've kept both scenarios on my previous charts as ETH price was a bit indecisive and seemed that there might be a chance of it going up again to form the "true" top. But as of now I'd say that the top of the right shoulder has formed now and its now forming the bottom before (if the H&S pattern does play out nicely) it rises back up. Previously I've said the bottom could be around the area of $600. But you'll see that I've now lowered it to $560. There are two reasons for this; 1 that sits on the longer trend line (green line) and 2 the $600 was calculated from a drop of $950 but as its top is "only" $830 then I'd say a bottom could be lower than $600.
What can also be seen is that the RSI hit 21 which means it's oversold. HOWEVER, that does not necessarily mean things will go back up again straight away. So don't pay too much attention to that.
Hope you've enjoyed this and as per usual this IS NOT trading advice. Please do your own research before trading.
Thanks