Ethereum Classic Price Technical Analysis
Ethereum classic price after trading a few points higher traded down. It looks like ETC may continue to head lower moving ahead.

Ethereum Classic Price Technical Analysis
SPONSORED ARTICLE: Tech Analysis articles are sponsored by SimpleFx - “Keep it simple!”,
SimpleFX is a robust online trading provider, offering trading with Forex CFDs on Bitcoins, Litecoins, indices, precious metals and energy. Offers and trading conditions simple and transparent.
Key Highlights
Ethereum classic price after bouncing a couple of times against the US Dollar traded down.
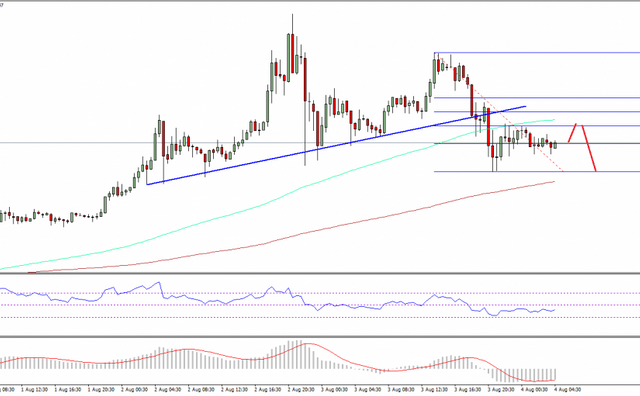
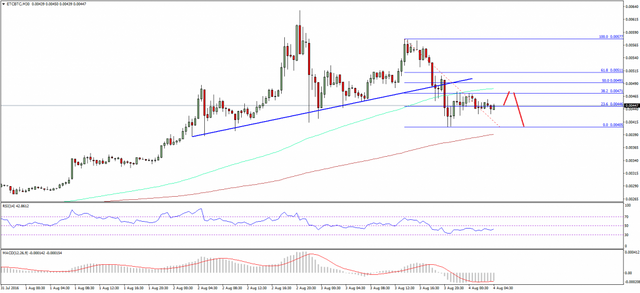
Yesterday’s highlighted bullish trend line on the hourly chart of ETC/BTC (data feed via Simplefx) was broken to open the doors for more losses.
If the recent break is true, then there is a chance of more losses in the short term.
Ethereum classic price after trading a few points higher traded down. It looks like ETC may continue to head lower moving ahead.
Ethereum Classic Price Support
Ethereum classic price ETC dipped once yesterday, tested a trend line support and traded higher. However, as I stated yesterday, I don’t recommend buying ETC for now. The result is clearly visible on charts, pointing that my view was correct. The price moved down later and broke yesterday’s highlighted bullish trend line on the hourly chart of ETC/BTC (data feed via Simplefx).
Once there was a break below the trend line support, there was a sharp downside move which took ETC/BTC towards 0.004BTC. A new low was formed at 0.00405BTC, and currently the price is attempting to recover. An initial resistance on the upside is around the 38.2% Fib retracement level of the last drop from the 0.0057BTC high to 0.00405BTC low.

Ethereum Classic Price Technical Analysis
The most important resistance is near the 100 hourly simple moving average, which is also just around the 50% Fib retracement level of the last drop from the 0.0057BTC high to 0.00405BTC low. I think, if the ETC/BTC pair corrects further higher, then it may face sellers near the 100 hourly simple moving average. One may consider selling rallies in the short term, but with caution as there might be false spikes.
Hourly MACD – The MACD is placed in the bearish slope, calling for more losses.
Hourly RSI – The RSI is also below the 50 level, which is signaling a downtrend in ETC.
Major Support Level – 0.0040BTC
Major Resistance Level – 0.0048BTC
Charts courtesy – SimpleFX
-Aayush Jindal-
Nice @treek
Shot you an Upvote :)
Good article