Predictability of EOS token price. Markets vs daily auction: who leads who?
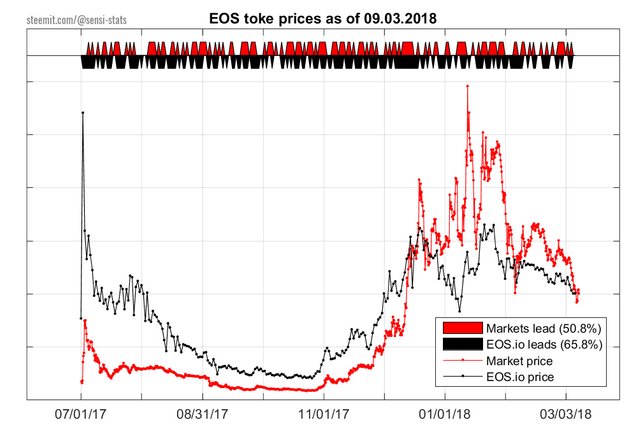
In this article we will look at the price dynamics of the EOS token distribution. Specifically we are going to investigate the dependency between the price established on the daily auction at EOS.io and the trading price at the exchanges. Then we will discuss what this dependency could mean in terms of price predictability or trading strategy.
We value your peer-review. Let us know about points we might have missed, all feedback is welcome.
Motivation:
The EOS project uses a novel token distribution method where each day an amount of fixed tokens (2.000.000) is distributed proportional to each participant's ETH contribution [1]. This creates a broader distribution and likely prevents "fear of missing out" swings where speculators with large holdings can manipulate the price.
The distribution adds a constant supply of tokens at intervals of 23 hours, while the EOS token is traded 24/7 on several exchanges. That's why we thought it would be interesting to study the interaction between these two price time series. We will try to answer this simple question:
What determines the daily EOS price movements? Is it the EOS.io distribution leading the markets or the markets leading the EOS.io distribution?
Data:
For market price we use the 6 hour EOS summary price data obtained from Coinmarketcap.com [2]. This price is the average price over all exchanges weighted according to trade volume. For the daily EOS.io distribution price we use the data obtained from Eosscan.io website [3].
Method:
- We focus on the EOS.io daily distributions: for each closing we check the earliest and latest market price within the last 23 hours and record an increase (+) or a decrease (-). We do the same for the next 23 hours.
- We also record the EOS.io price trend (+/-) with respect to the previous and next day.
- For each day we obtain a 2 by 2 matrix where the top row shows the EOS.io price trend with respect to a day before and a day later. The bottom row shows the same for the market price.
- Based on who leads who we expect the following patterns in the 2 by 2 matrices:
If EOS.io leads markets:
         prev next   OR   prev next

EOS.io     + | .            - | .

Market     . | +            . | -
if markets lead EOS.io:
         prev next   OR   prev next

EOS.io     . | +            . | -

Market     + | .            - | .
In this way we create 260 matrices and check if we observe a EOS.io lead (black area) or a market lead (red area) pattern.

Interpretation:
Of all the 260 days analyzed, 132 (51%) have a markets lead patterns. This is very close to what we would expect by random chance. Whereas, 171 (66%) days show a EOS.io leads pattern. This is very unlikely to be due to random chance: imagine throwing 2 coins 260 times and observing double heads or double tails a total of 171 times. Thus we can conclude that EOS.io distribution price is likely leading the market price.
Limitations:
The analysis shows that, if an observed increase (or decrease) in the daily EOS.io price is used to predict an increase (or decrease) on the market price then such a prediction would have a success rate of 66%. However, it is important to note that the analysis is binary (i.e based only on decrease or increase, not on how big the actual values are). Thus it is not clear if this can lead to a profitable trading strategy.
Additionally, if such a trading strategy is indeed profitable, it is likely that the pattern will cease to exist once it becomes publicly known and exploited (assuming efficient markets and rational traders).
We value your peer-review. Let us know about points we might have missed, all feedback is welcome.
Interesting I also was interested to this correlation
Congratulations @sensi-stats! You have completed the following achievement on the Steem blockchain and have been rewarded with new badge(s) :
Click here to view your Board
If you no longer want to receive notifications, reply to this comment with the word
STOP