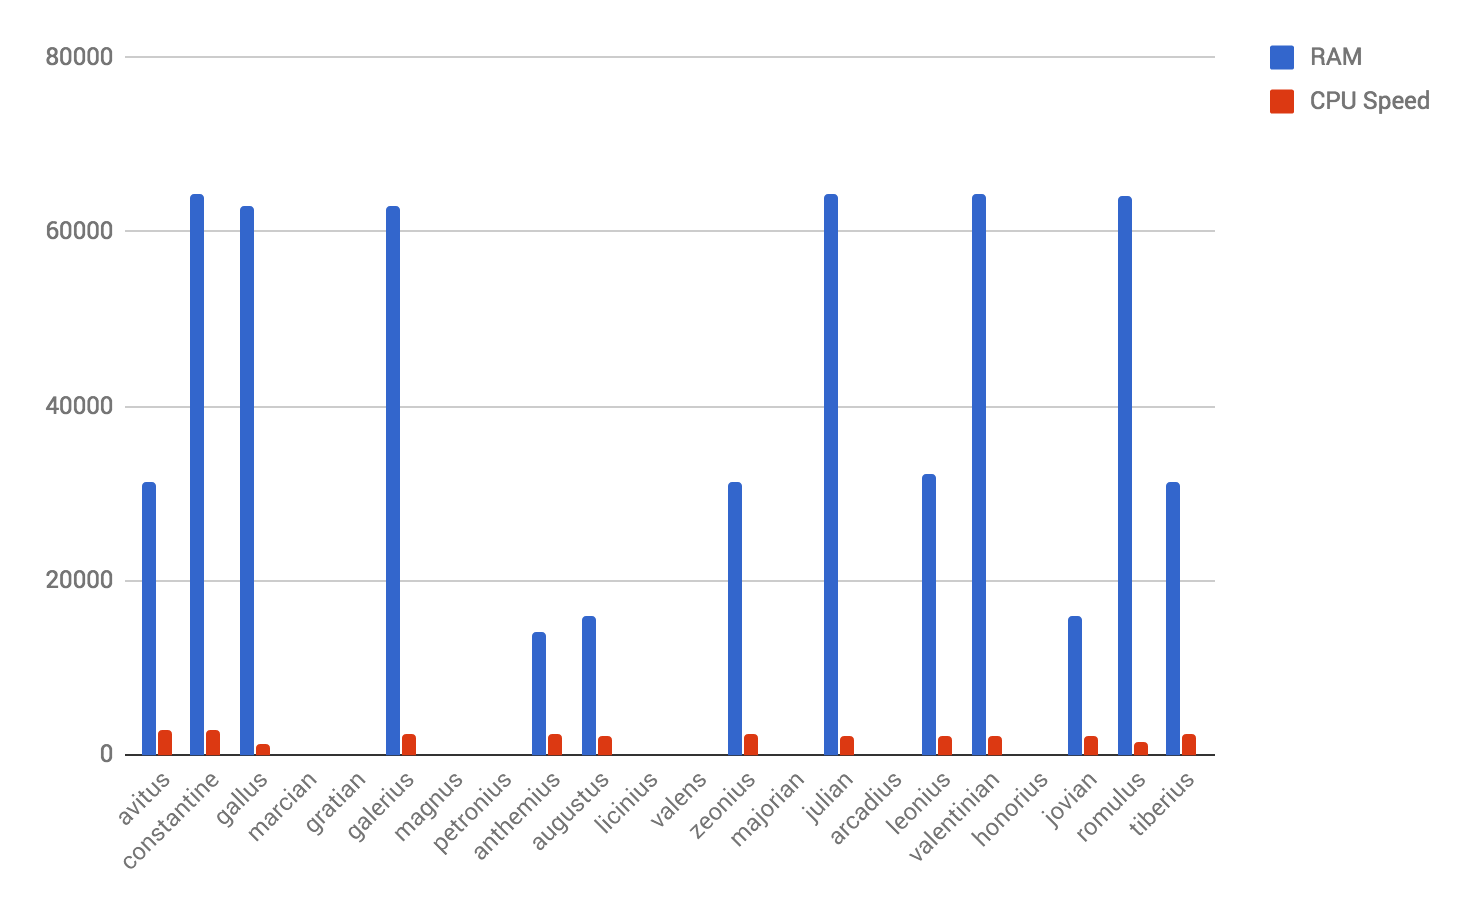
EOS Tribe Testnet and Block Producer Node Statistics

In our continuing commitment to ensure the integrity of the EOS network, we are happy to announce out first in a series of BP technical reports.
Our goal with this project was to provide the most accurate information about Block Producer hardware and technical specifications available.
Over the last 30 days, since our initial testnet announcement for Arrowhead, we have been collecting statistics on up time, hardware and geographic distribution.

Visualizing BP Node Perfomance
The above chart was the result of some preliminary benchmarks of CPU and RAM allocation on active node data we have tracked across the network. Some nodes are really standing out.
We are working to present this data into various visualizations that will make it more digestible for the community at large.
This is the first in a series of reports that we plan to provide.
You can view the report live here...

BP Node Monitor Script
Below are instructions for installing the BP Node monitor script (Perl) as a cronjob on Ubuntu server for your EOS Testnet node:
Prerequisites
In this script, we assume your installation is in your - /opt/monitor folder. If you use a different folder please adjust accordingly.
Assuming Perl is installed in system (usually default for Ubuntu). If you do not have it, please make sure you install related Perl dependancies.
1. Start by making sure you are in the appropriate directory
cd /opt/monitor2. Install the script
wget https://raw.githubusercontent.com/EOSTribe/arrowhead/master/monitor.pl3. Modify write permissions
chmod +x monitor.pl4. Install Perl modules used by the script (not installed by default):
cpan install LWP::UserAgent
cpan install Sys::Info
5. Try running it passing EOS node data-dir folder to test it works
perl /opt/monitor/monitor.pl /opt/arrowhead6. If everything is OK, you get no errors and the script runs and exits with no output, then install cronjob to run every10 mins:
crontab -e7. Once you have the tab opened up, add following line
0,10,20,30,40,50 * * * * perl /opt/monitor/monitor.pl /opt/arrowheadAnd you are done!
Besides reporting server stats to our report server, the script also checks if the nodeos process is running and starts it if it stopped due to failure.
We found this to be a huge time saver, especially if you are running on multiple test nets. we know first hand it can be hard to keep up with.
BP Node Monitor App
In the spirit of collaboration we have released the application so other BP candidates running testnets can also collect statistics as needed.
You can access that here.
Connect With Us
- Website - https://eostribe.io
- Github - https://github.com/eostribe
- Telegram - http://t.me/EOSTribe
- Facebook - https://www.facebook.com/groups/eostribe
- Twitter - https://twitter.com/eostribe
- Medium - https://medium.com/eostribe
- Dischord - https://discord.gg/Su7pDGt

Information for BP Candidates - if you are running node either on Arrowhead and Jungle Testnets and if you want your hardware stats to be visible on report - you will need to install monitor tool:
https://busy.org/@eluzgin/how-to-configure-performance-monitor-for-testnet-node
I updated the post to include your script @eluzgin
Hi, do you think you could include nodeos software version as a hexadecimal number on your report? I think it is important for BP's to either be current or have to explicitly state why they are choosing not to.
Yes, that's a great idea @philmesnier. I will pass this along to @eluzgin