EOS Chart Update (EOS/USD): EOS being held by Converging resistances, some more sideways trading is expected before the Bang.
Analysis Summary:
Hi friends welcome to this Daily analysis of my favorite crypto asset EOS once again,

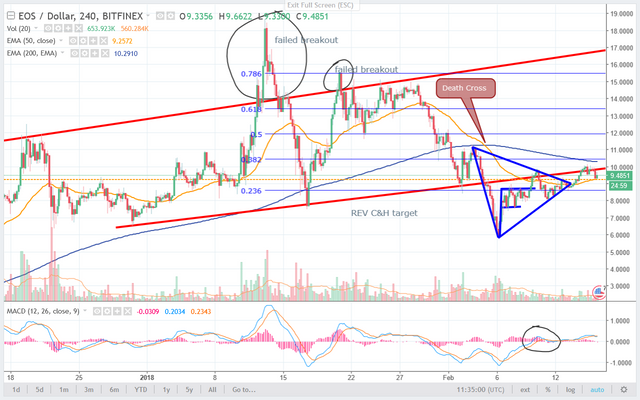
Looking at the 4 hour chart we can see that EOS has been trading sideways since breaking out from the bullish flag it formed from the first upturn and taken days to reach the target calculated from that flag. In my last post I suspected that sideways trading is expected due to availability of some strong resistances above.
However we can see that EOS has formed a bullish triangle by its sideways movement and breakout from this triangle has already happened, during this breakout EOS has moved above EMA50 (orange) which will now be expected to behave like a strong support.
However the Upward rally is currently being checked by the convergence of resistances like EMA50 and the bottom of upward wedge, a breakout above the bottom of wedge will again bring EOS back inside the overall upward movement it had and that can be expected to be a strong bull signal which can help with Breaking above the EMA200 (blue) as well. But so far MACD is not supporting bulls and volume has been even on both sell and buy sides.
Looking at the upside if we calculate a target from the size of triangle then a test to top of the channel again looks to be in sight however before setting that target EOS needs to prove itself by breaking above the immediate resistances above it.
That will be all for now, I will keep you posted for any further developments in the chart.
Good Bye and Best of luck to you all Have a good time and trade safely.

Great post! You just got a 34.06% upvote from @edensgarden!
Thanks for tasting the eden!