Short tf (4hr) analysis of XRPUSD (Ripple)
XRP made a high of $3.31 on Jan 4 2018 after which it sold off with price appearing to bottom on Feb 6 2018 at a price of $0.59. The downtrend line is marked on the chart to show the bear move between the prices mentioned above.
A curve has been used on this chart as well to show the bottom action of price in Ripple (XRP). It appears to be a complex, inverted Head (H) and shoulder pattern with one left shoulder (LS) and two right shoulders ( RS). The neckline for the complex, inverted Head and shoulders (or Head and shoulders bottom) pattern is indicated by the red line.
Price action has clearly closed above the Head and shoulders bottom pattern and therefore confirms the pattern as valid. This means that bulls are ready to drive prices higher. It is likely that price might quickly deep to the $1.06 area which is where I have marked on the chart as the likely point of trade entry.
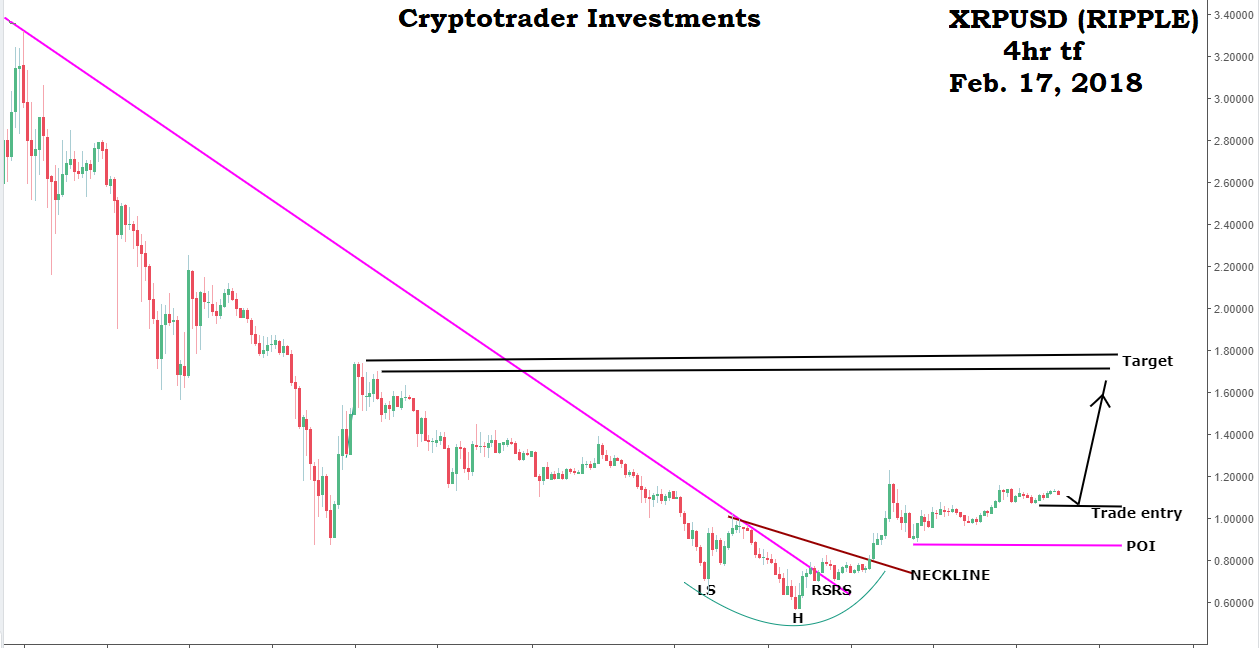
POI = The price at which this trade is no longer valid (i.e. price closing below $0.87)
The least possible target area for the trade is between $1.71 and $1.77
Assuming the situation above, RISK = $1.06 - $0.88 = $0.18
Reward = $1.71- $1.06 = $0.56
Risk/Reward ratio: 0.56/0.18 = ~3:1
Disclaimer: The chart and comments above are my own opinion and should NOT be considered a buy or sell recommendation
Congratulations @cryptotrader0029! You have completed some achievement on Steemit and have been rewarded with new badge(s) :
Click on any badge to view your own Board of Honor on SteemitBoard.
For more information about SteemitBoard, click here
If you no longer want to receive notifications, reply to this comment with the word
STOP