Elliott Wave Analysis of BTCUSD (4/3/18)
This is not investment advice:
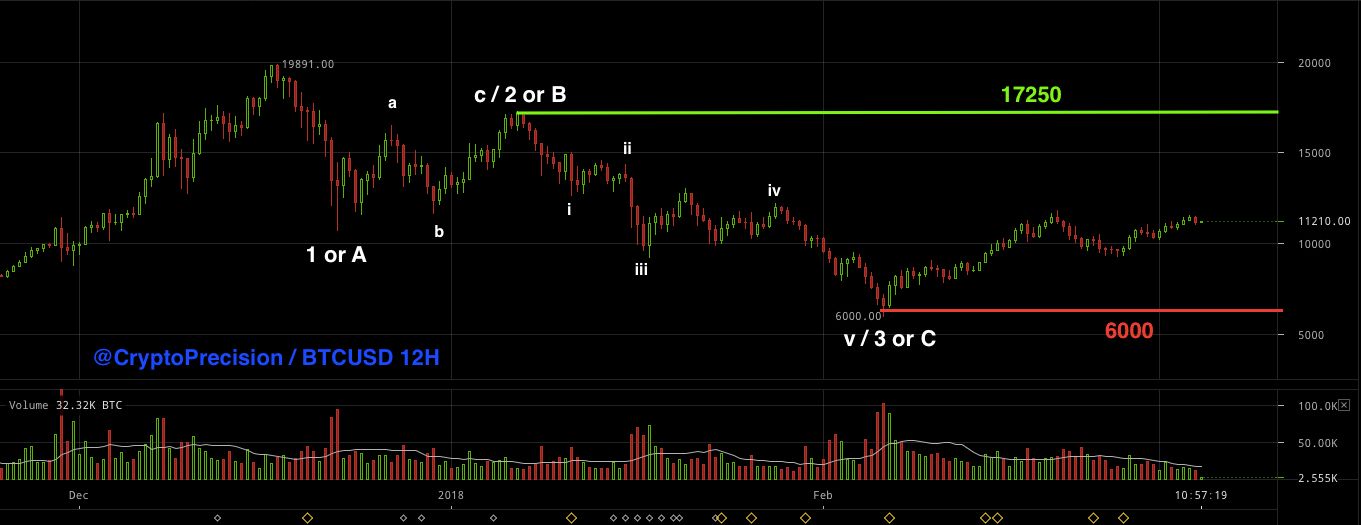
From the market high on 17th Dec 2017 to the low on the 6th Feb 2018, there has been 3 primary movements: motive, corrective, motive.
These movements represent a motive wave 1 or A, a corrective wave 2 or B, and a motive wave 3 or C.
If the entire downward movement is an ABC downward correction of the larger upward move of 2017, then the market low at $6000 is in, and we should be on our way to new all time highs. A break above $17250 would confirm this, because as we break the head of wave 2, we invalidate the possibility of a downward motive wave 4 and 5 occurring. This is the bullish scenario.
If however the entire downward movement is a 123 downward motive wave, against the upward trend of 2017, then the market low at $6000 will likely be broken. The current price action puts us at wave 4, and a downward wave 5 in time will break the $6000 low typically, or truncate to create a double bottom at around $6000. This is the bearish scenario.
%204.3.18.jpg)
if we close higher above 13k I think 6k totally out of question
anythings possible