USDCHF Elliott Wave Analysis: Looks For A Pullback
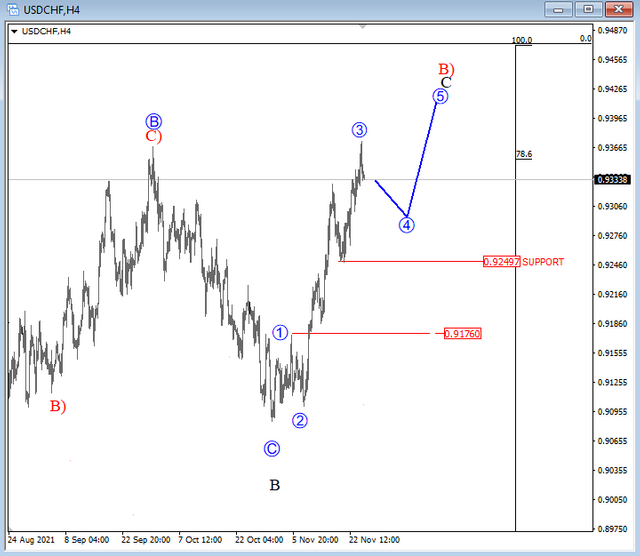
Swissy is coming sharply up, breaking even September highs, but we are still tracking a corrective rise within wave B) on a daily chart that can stop around April highs and 0.94 - 0.95 area. On the 4-hour chart we are looking for a five-wave rally within wave C of B), so more upside can be seen for wave 5, but ideally after a pullback in subwave 4 with support in the 0.9300 - 0.9250 zone.
USDCHF 4h Elliott Wave Analysis
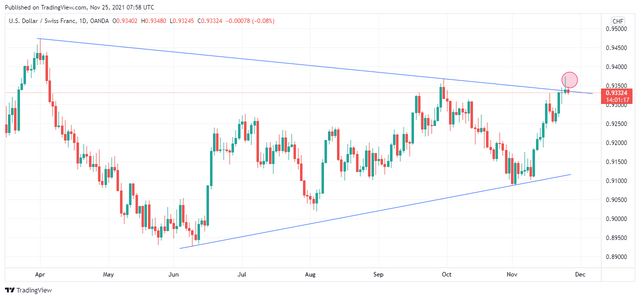
Technically USDCHF forms Shooting Star Candlestick pattern on upper trend line of triangle formation, suggests that we may see some pause in the upside move of Swiss franc.
USCHF Candlestick Chart
more at https://wavetraders.com