Dynamic Reports: Make Your Reports Move
1. What Are the Dynamic Reports?
Dynamic reports are not only mean the reports composed of dynamic charts. Dynamic reports are generated based on the latest information and provide interactive features that allow end-users to do various types of data analysis with ease. In brief, dynamic reports are real-time reporting +interactive reports.
2. Dynamic Report Examples
Note: The examples above are made with FineReport.
a.Parameter filters: Filtering with parameters is the primary function of the dynamic reports. When using multiple data sources, you can use parameters to select or input value to filter all the data you want.
b. Parameter linkage: Linking parameters is another basic function of dynamic reports. It builds a correlation between two charts. For example, when you click the city on the map, the correlated charts will show the corresponding product analysis and customer analysis of this city.
c. Drill down: Drill down report is a common type of dynamic reports. It enables the user to navigate the data from a comprehensive view of the data to a more detailed one.
d. Dynamic display on the parameter panel: In many cases, the selected option in one drop-down box can control the options in another drop-down box. For example, You can query the information during any period when you choose query by day. However, when you select query by month, the data will only be available within a specific month.
e. Dynamic conditions: If you want to filter the data in the table, you are uncertain about the specific query conditions, the dynamic conditions will help you solve your problem.
For example, you forget the supplier’s full name and only remember that it begins with ‘Li’. Input ‘Li’ in the text box and click ‘Query,’ all the suppliers whose name contains ‘Li’ will be listed.
3. How to Make Interactive Reports?
We have talked about real-time reporting in detail in the last article, including the benefits and how to implement it.
Many readers left the message that real-time reporting frees them from repetitive work. And they were surprised by how easy it is to implement the real-time reporting following the tutorial
So, the following tutorial will focus on the interactive part of dynamic reports. And I will use FineReport in the tutorial because it is easiest to make interactive reports after I tried a lot of dynamic reporting tools.
Let’s take this dynamic report as an example, which is a typical interactive report in the business. You can query the information of specific cities, and the ‘region’ box control the ‘province’ box, the ‘province’ box control the ‘city’ box.
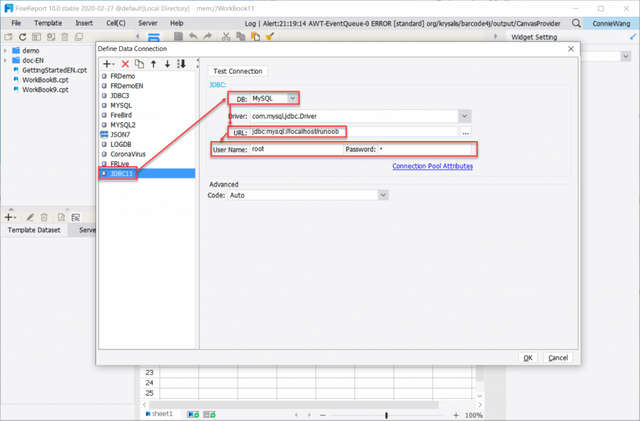
Step 1: Connect to the database and import the data
FineReport supports multiple data sources, including Excel. You can connect to the databases in a few clicks.
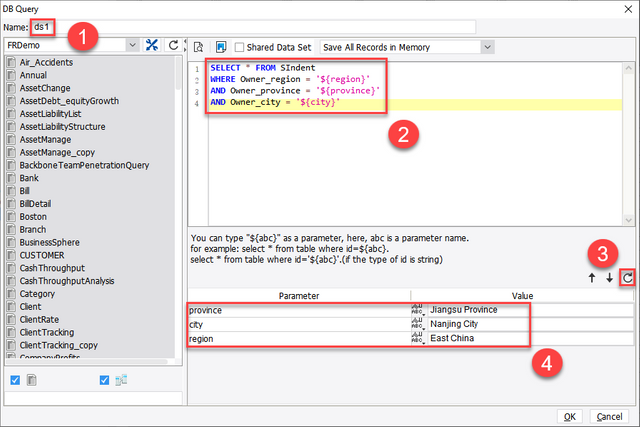
Step 2: Create a dataset with parameters
This step is to define the parameters. In this step, all you need is simple SQL rather than complex programming languages. For the IT department, I believe SQL is a piece of cake. But don’t worry if you don’t know SQL before. This operation only requires basic SQL, and it won’t take you long to master it.
1.Create dataset [ds1] with 3 parameters
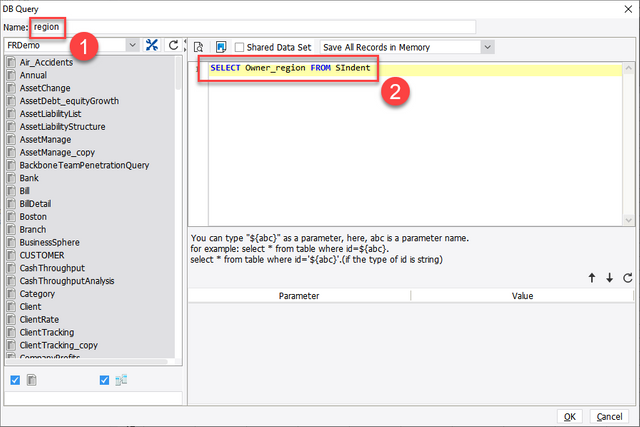
2.Create dataset [region] to query all regions
3.Create a dataset [province] with a parameter to query provinces in a certain region
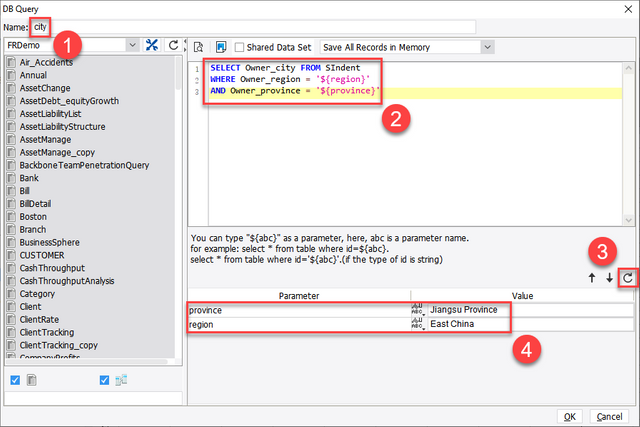
4.Create a dataset [province] with a parameter to query cities in certain regions and provinces

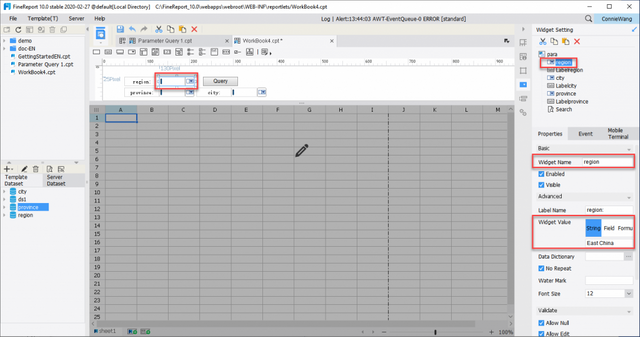
Step 3: Set widgets in the parameter interface
FineReport provides dozens of controls such as text field, drop-down tree, checkbox, time, date, drop-down box.
After binding the control and values, you can freely control and filter the content of the report display.
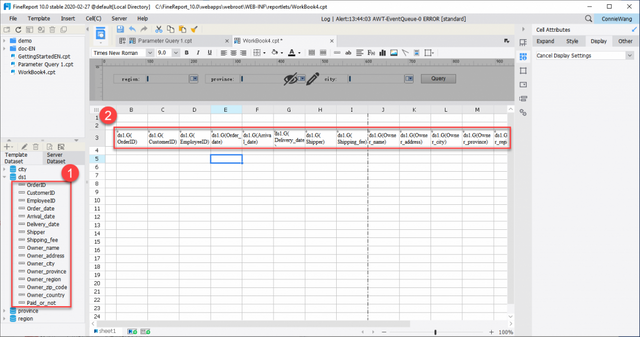
Step 4: Drag data columns into cells
4. Leverage Dynamic Reporting Tools to Make Your Reports Stunning
As shown above, use dynamic reporting tools such as FineReport is easy to make reports real-time and interactive. However, the advantages of FineReport in visualization is beyond these.
Let’s discover how to use FineReport to make your reports a difference.
19 categories and 50+ styles HTML charts
FineReport supports dozens of charts that meet different needs in business. These charts are self-developed by HTML5, which can be be used cross-platform, adaptive to web design, and support instant update.
Various dynamic interactive effects
Except for the interactions shown above, there are numerous cool dynamic charts. And you can use data tips, interactive highlighting, series interaction, online switch, coordinate scaling, and automatic refresh to realize interactive analysis.
Stunning 3D map and other 3D visualization effects
FineReport provides cool maps with advanced chart effects, as a supplement to basic types of charts. FineReport supports 3D cylindrical earth, 3D point earth, 3D flow on earth, KPI card, particle flip counter, time gear, catalog gear, carousel GIS point map, and so on.
Besides, FineReport provides a reporting portal to manage these dynamic reports.
Original Source: https://www.finereport.com/en/reporting-tools/dynamic-reports-interactive-reports.html