SLC S21 Week3 || Mastering Records and Record Arrays with Python

Greetings Steemit friends
1) Develop a Python program to manage employee records using Dataclass. The program should support adding, updating, and displaying employee information, along with calculating average performance scores and identifying top performers.
Here is a light program developed to manage employee records using a dataset. A data set is a collection of well-structured data put together for processing. It is organized in rows and columns holding any form of data type. Here, we will be able to store and manage data, as we create structured data containers. For our program, following the example, I define the Employee Data class. As required by the task, the data class will store the employee information. The program will ask for the employee ID, name, age, position, salary, and list of performance scores. List here means we will have more than one entry, which will need to be handled as an array.
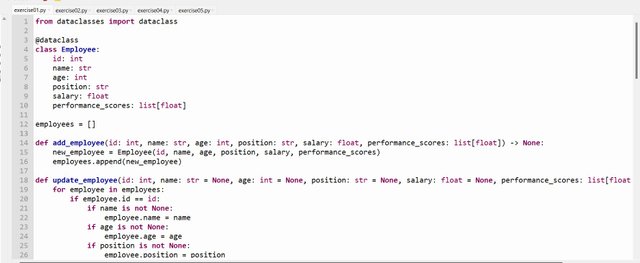

Next, I have to create a function to add a new employee. The function will take the parameters to represent the employee's required information. We go ahead and create an instance of the Class Employee, with the new data, and append it to the list employee, For us to be able to append the new_employee to our list. I had to initiate an empty list employee, which will store all instances created by an Employee object. that is adding, updating deleting, etc. At this point, if we run our program. We have the list of employees, with the performance score in curl brackets.
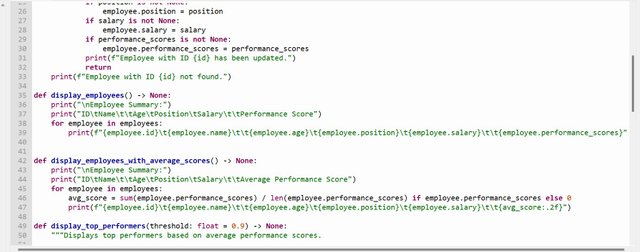
Next function, if the updater function. Data can be updated based on a unique identifier, and in our case, we used the id. So here, the most required parameter is the id. We will use the id to loop through all the employees, to find the match. Now, the program continues to check each parameter. If in case any new data is inputted, will go ahead to update the instance and store it in the list.
Last but not least. Function to calculate the employee average score. We already have a function to display our input, we now find a way to modify it to have the average and not the list.
For each iteration, I have defined a variable avg_score. The total performance score is the sum divided by the number of scores entered. Where no score was entered, the output is set to zero(0).
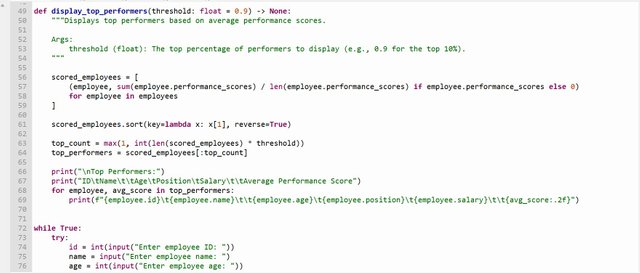
The last function required for our program. Function to identify the employer with the highest average score for performance. For us to have top performance, we need to set a threshold.
Let's create a new list, different from the employee list. This list will hold just the top score performance. This list will hold data of each employee and their avg_score, which we will sort based on the avg_score. Select the top performance and print.
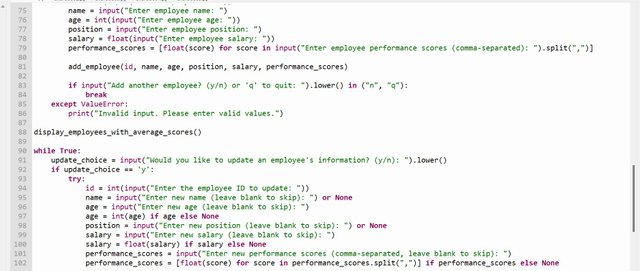
The rest of the code is the loop to permits the user to input the required information from id, name, age, position, and salary, down to the list of performance_scores.
Now we can use our add employee function to enter new data into the employee list. Test to have the working result by running the function to display the employee list
Next is the loop to permits the user to update a piece of employee information. I make use of the y/n as a switch for the user, and the possibility to leave an input blank.
Now we can make use of the update employee function to modify existing data. Finally, we have the display functions to our final result.
####2) Objective: Utilize NumPy's structured arrays to store and analyze student grades, including calculating averages, identifying top students, and analyzing subject-wise performance.
NumPy is the library for numerical computing in Python to help give efficient array operations. Following the outline in the section for working with record arrays. From there, we will follow to build to import and define structured arrays for students. We can use the data in the array to calculate the average of each student. Getting the average, will be easy to calculate and get the student with the highest average. Now we calculate the average of each subject for all the students and identify the different performances of the students based on the average.
Okay, let's start by importing numpy which will be used for structured arrays and carrying out numerical operations. Next, we define our structure array, specifying the name and data type.
i4: 4-byte integer
U20: 20 character (string)
f4: 4-byte float
Now, we can go ahead to create a structured array for students containing the id, name, and grades for the different subjects.
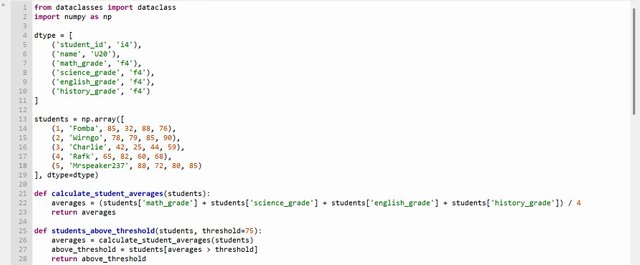
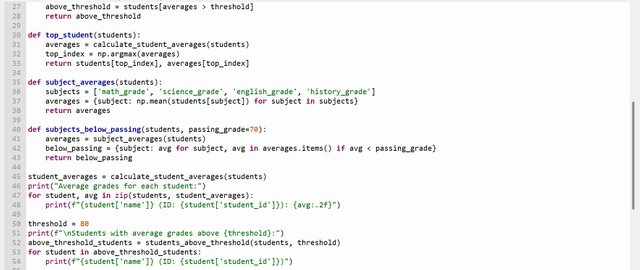

To calculate the average for each student, let's create our first function. We sum all four grades, divide by 4, and return the average.
For us to be able to get the top student, we need to get the average of each student and find the index of the highest average sum np.argmax. Here we will be able to get the student records and averages.
Set a threshold and pass in the function to output the array of students above the threshold.
Next, a function is to calculate the average for each subject, list the subjects, and compute the average using np.mean for each subject across all students. Here we will be able to return each subject and its corresponding average grade.
Lastly, a function to get to identify the subjects based on the performance average grade. We can assign a parameter to handle passed grades or as a variable in the function. We need the subject average to get students, which we have a function already to perform that operation. Next, we will filter for subjects below the passed grade and return the subject and average grade.
From here, we run the functions to see the different output. Note, it is important to run every function for debugging before moving to the next.
3.) Develop an inventory management system using namedtuple to track products, including functionalities for low stock alerts and identifying high-value products.
This is pretty much simple and less complicated than the previous task. Here we will make use of the namedtuple, which will help to structure inventory items in Product. With the namedtuple handling the product fields, we can go ahead to create functions.
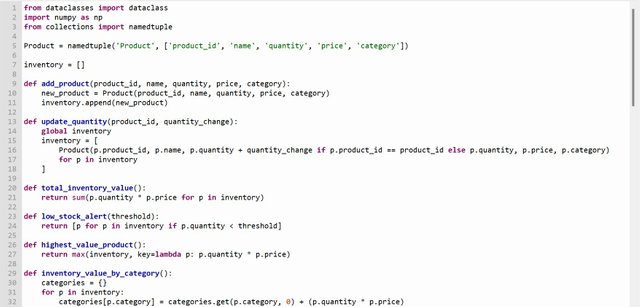

The first function is to add new products to the inventory list. This function holds the parameters to create a Product object and append it to the inventory.
The next function on updating quantity based on a unique identifier which is the id. So function carries two parameters, the id and the new quantity which can either increase or decrease the stock.
The next function is the total inventory, this function operation is direct. To identify the quantity that has gone below the threshold, which will help to alert low stock of a particular stock.
Lastly, a function to return the highest value product and the inventory value group by category.
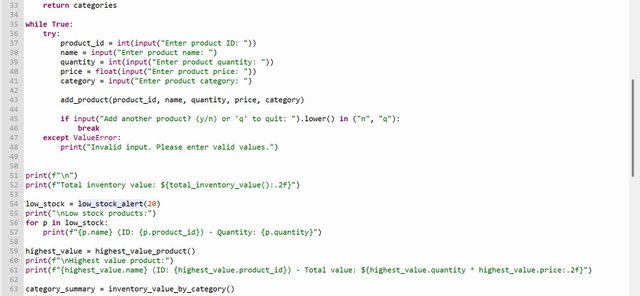
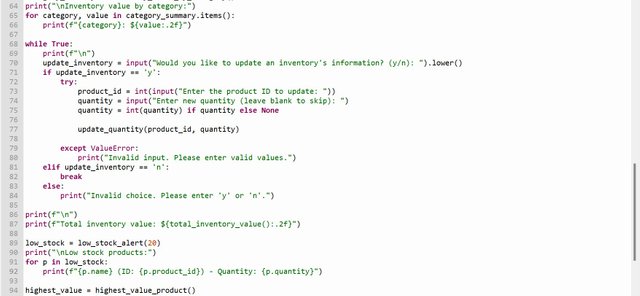
We are done with the necessary functions, and time for a storekeeper to add inventory We make use of a loop to prompt the user to add products following the parameters to create a Product object which will be appended to the inventory list. I just made some changes to what we have on our first task.
Now we run our functions to display our result and prompt if the user wants to update an inventory.
Re-displays total inventory value, low stock products, highest value product, and inventory by category after updates taking into account the most recent changes.
4) Create a program to process customer orders using NumPy's structured arrays, including functionalities for calculating order totals, identifying large orders, and analyzing customer purchasing patterns.
To develop our program using NumPy's, which will help us compute array operations. Like our second task, we define our data structure using dtype to assign the specific data type.
Next, we can go ahead to create the array using the defined dtype. To calculate the order total, I define the function that will return the total price by multiplying the quantity and price per unit.
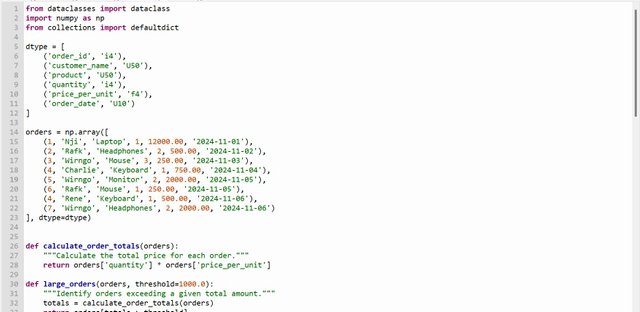
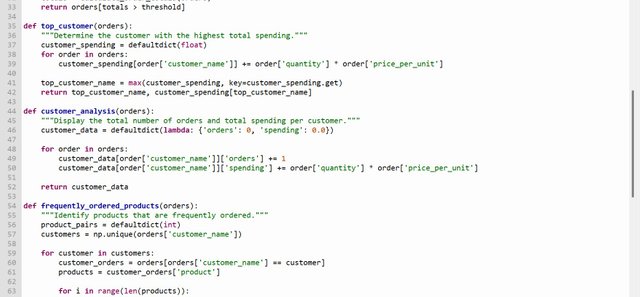
To identify the large order, we need to set a threshold. If the calculated total order is greater than the threshold, the function will return true.
Now let's find the customer with the highest total spending. Here I will iterate through the orders and calculate the total spending for each customer. Now, defaultdict is used to aggregate customer spending and initialize counters. The Max() is used to have the customer with the highest total spending.
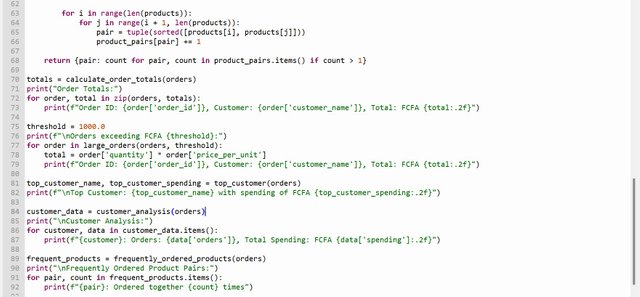
The last function is to find the products that are frequently ordered. Here we generate pairs of orders by the same customer and count the occurrences. Now our function will return pairs ordered more than once.
Now we can go ahead to run our functions and print the respective output.
5.) Analyze weather data using dataclass and NumPy, including functionalities for calculating averages, identifying trends, and detecting anomalies.
To develop the program using a dataclass and NumPy. Let's start by importing the necessary libraries and defining the weather record dataclass. We have the dataclass for creating classes, numpy for numerical computing, DateTime to be able to manipulate dates, and typing.list to help in specifying lists of the Weather Record objects.
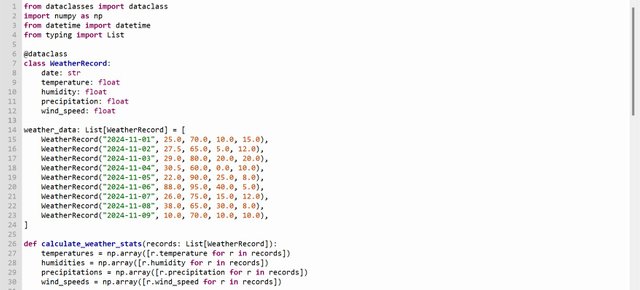
Now let's create our data class which will hold the information about a day. Next, let's put together sample weather records in the list.
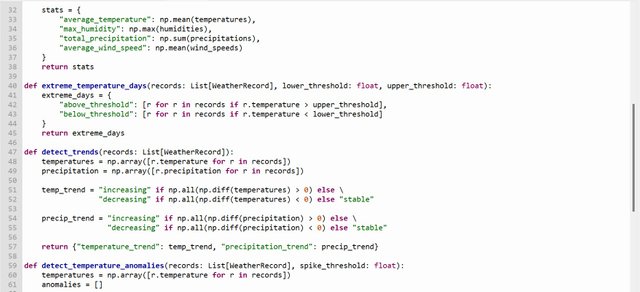
Our first function is to calculate the average. We have to extract each attribute and calculate the statistic using the Numpy function (mean, max, sum)
To be able to identify the temperatures above or below certain thresholds. The function passing list, the lower threshold, and the upper threshold filter the temperature of days out of the threshold.
To Detect trends in temperature and precipitation over time, we make use of the np.diff to get the difference for consecutive days. Next, we check if the difference is positive or negative. Positive will imply the difference is increasing and negative will mean it decreasing.
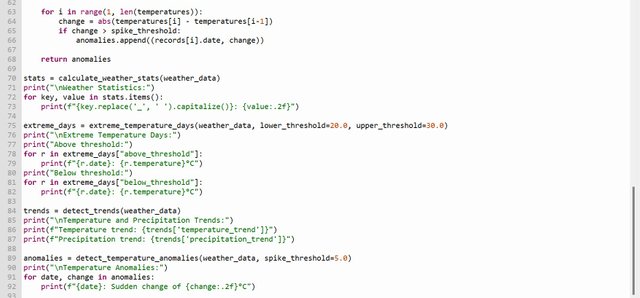
Finally, to identify anomalies such as sudden temperature spikes or drops, we have to set a spike threshold to filter days with sudden temperature changes. With the if statement, when the temperature exceeds the threshold, the function returns anomalies.
The rest of the code is running the functions.
Great example of using different approaches to solve data management problems! Very interesting how tools like dataclass, numpy and namedtuple can be applied in different cases. Each task is demonstrated with visual examples, which makes understanding the solution simple and accessible. I especially liked the idea of analyzing employee productivity and analyzing order data using numpy. All these methods are ideal for working with large amounts of data and for effective decision making. Great job!