DGBBTC Analysis
Hello everyone. Today I'll take a look at the Digibyte/Bitcoin chart, which looks kinda promising longterm.
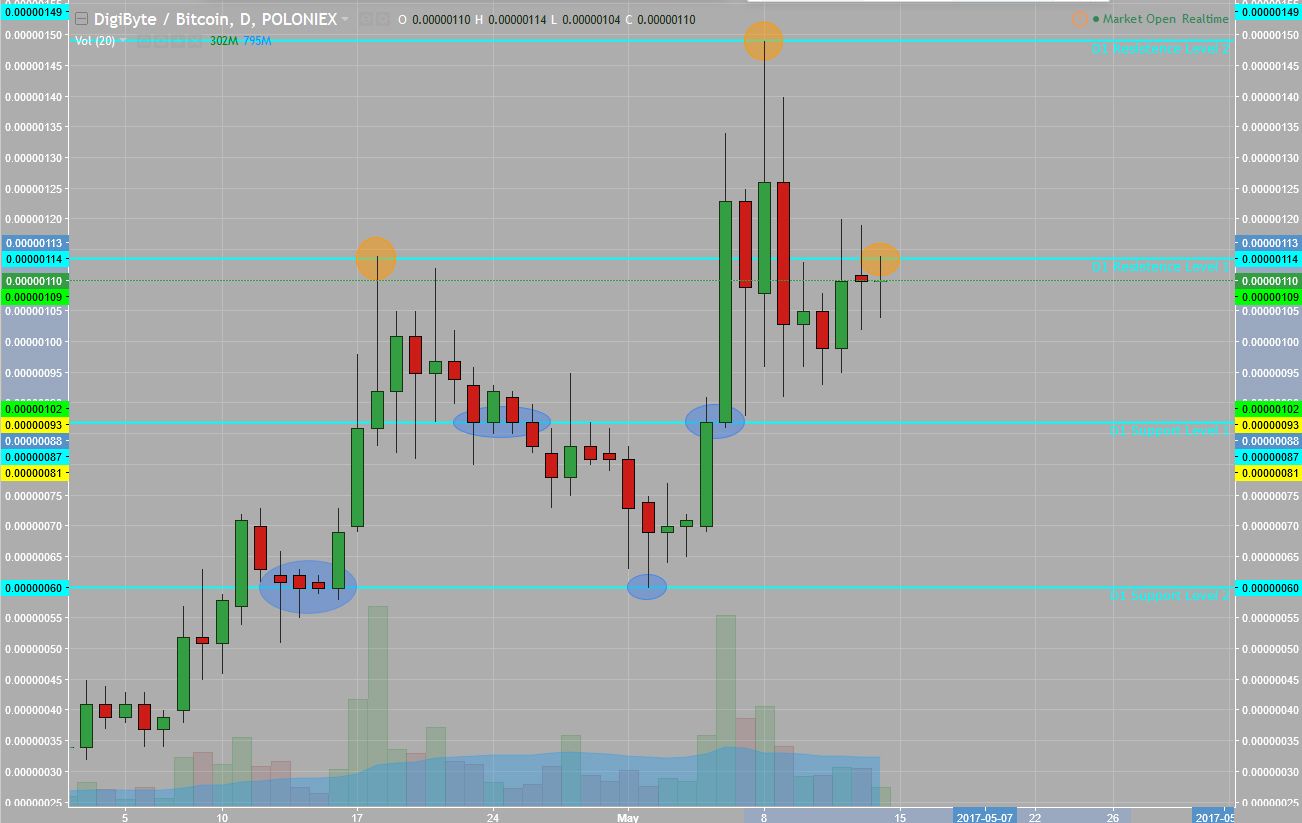
One week ago we witnessed a nice push on the chart from 60 Satochi to 150 Satochi within 6 days. That's amazing and reason enough to take another look at Digibyte. With the DDoS-attack against both, Kraken and Poloniex, on monday, almost every altcoin dropped. People were saving their money. Also DigiByte got affected by that, which caused a huge drop down to 91 Satochi. Now, trying to correct itself, the chart is facing different resistence and support level, which you can see on the next picture:

The blue and orange circles mark former support and resistence areas, where the chart changed it's direction. Currently Digibyte it trying to break the resistence level at 114 Satochi. Finding support at the blue trendline, the chart is ready for a possible breakout. But before that happens, let's take a look at the indicators for this daily chart:

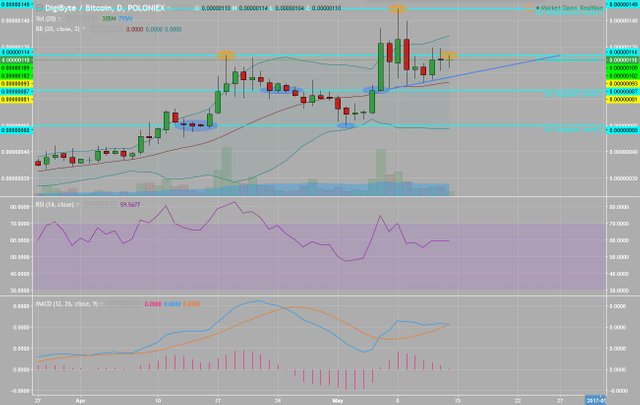
The RSI indicator is always something to look at. We can see that the market is not overbought, but for now there's also no buying signal. So we could judge the RSI as a neutral property in our analysis, but keep in mind the market is not overbought.
On the MACD chart we can expect a crossing of the MACD and its trigger line. Due to the fact that the MACD is crossing the trigger from above, this can be seen as a signal to go short. I don't think that this is a bad signal, because in this analysis we are looking at the chart for a mid- to longterm investment.
Futhermore, this could generate some extra power for a possible breakout, if the MACD will cross the triggerline from below in the future (strong buying signal).
The last indicator added for this analysis are the Bollinger Bands. For those of you, who don't know about the Bollinger Bands right now, let me explain it in a few words.
Bollinger Bands work as the normal distribution of a chart. The theory is that the course will always bounce back to it's moving average, which you can see in the above picture (red line). In the case of the Bollinger Bands we need to add a value for the standard deviation, which will created to bands around the moving average. In this example I choosed a standard deviation of 2 with a 20 days moving average. If the chart is hitting its average from above this can be seen as another buying signal. If its hitting the standard deviation (bands) this can be seen as a signal to trade into the dicrection of the average. Also if the bands are tighter together this can be another breakout possibility.
Back to the analysis. We can see that the course is above it's average and the MACD will possibly send a selling signal. This leads me to the conclusion to expect falling courses. If the chart will get support by its trendline and the MACD will send a buying signal in the future, then we could expect a break of the 114 Satochi resistence Level. Depending on the Bollinger Bands gap we will see if the breakout will be a big one or not.
Background: For my detailed analysis I was choosing different trendlevel (1D, 4H, 15M), but decided to reduce this post to the daily chart only, for complexitiy reasons.
Great, should be a nice third wave coming in for all the cryptos! Lets get ready to surf the volitility!
Hopefully, we will see another nice breakout. Market capitalization for all cryptos still raising :)
DGB broke the level 2 resistence today, which caused a huge push. Congrats everyone who invested :)