And the band plays on and on and on (as the ship goes down). Government debt, money supply, prices, and inflation.
The Maastricht Treaty specifies that the ratio of gross government debt to GDP must not exceed 60%. Several European countries exceeded the limit some years ago. That not only includes the obvious candidates known as the “PIGS”, (Portugal, Italy, Greece and Spain), but it also includes some of the more “credit-worthy” countries, (France, UK, and Deutschland). I’m not sure what to call the latter group.
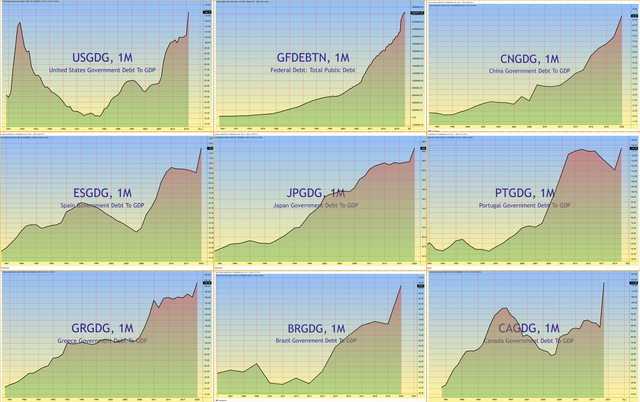
The rise in Debt-to-GDP ratio is not a new phenomenon related to Covid. The ratio has been rising for years as illustrated below. The earlier peak for the USA was related to World War 2 spending. As you can see in the first chart, the ratio today is higher than that peak.
How high can the ratio go before the brown stuff hits the fan? Answer: Nobody knows. It’s already well beyond the point of no return. Central Banks will do what they can to keep the status quo. We may have years to wait before it all goes to pot, or it might blow up this year.

The question Mr Lombard might ask is “Who is foolish enough to lend to a bankrupt government?”.
The answer is plain for all to see. It’s the Central Banks. The Central bank simply prints the money it lends to the government. The government then spends the money it just borrowed. Everyone is happy now.
You can see how much money the central banks are printing by looking at their balance sheets, or simply looking at the money supply statistics. Below you can see the money supply of some major countries. The spikes for China are related to Chinese new Year when everyone gives away loads of little “red-envelopes”.

The obvious question must be “Will all this printing make prices go up?” Answer: It depends on what people do with the money. If they spend it, the velocity of circulation will rise, causing prices to rise. On the other hand, if they save it, or invest it, it will only affect the price of the asset they invest in.
Looking at the chart below we can conclude that since the onset of Covid, people are saving instead of spending. Less going out, less travel, less entertaining, less partying etc. The velocity of circulation of money is falling.

So where is all the saved money going? Answer: Some of it is going into Commodities like gold and oil.

It’s not just commodity prices rising. Stocks, house prices and crypto currencies are absorbing investor cash (look in particular at the Swiss House Price Index below. Switzerland is one of the countries with the lowest rate of inflation.).

Pandemic measures are winding down. Life will return to normal. Spending will resume. Guess what happens next...

Let me spell it out for those who need an interpretation. Prices will start rising faster and faster.