DAX - TA 29-10-2018
1M
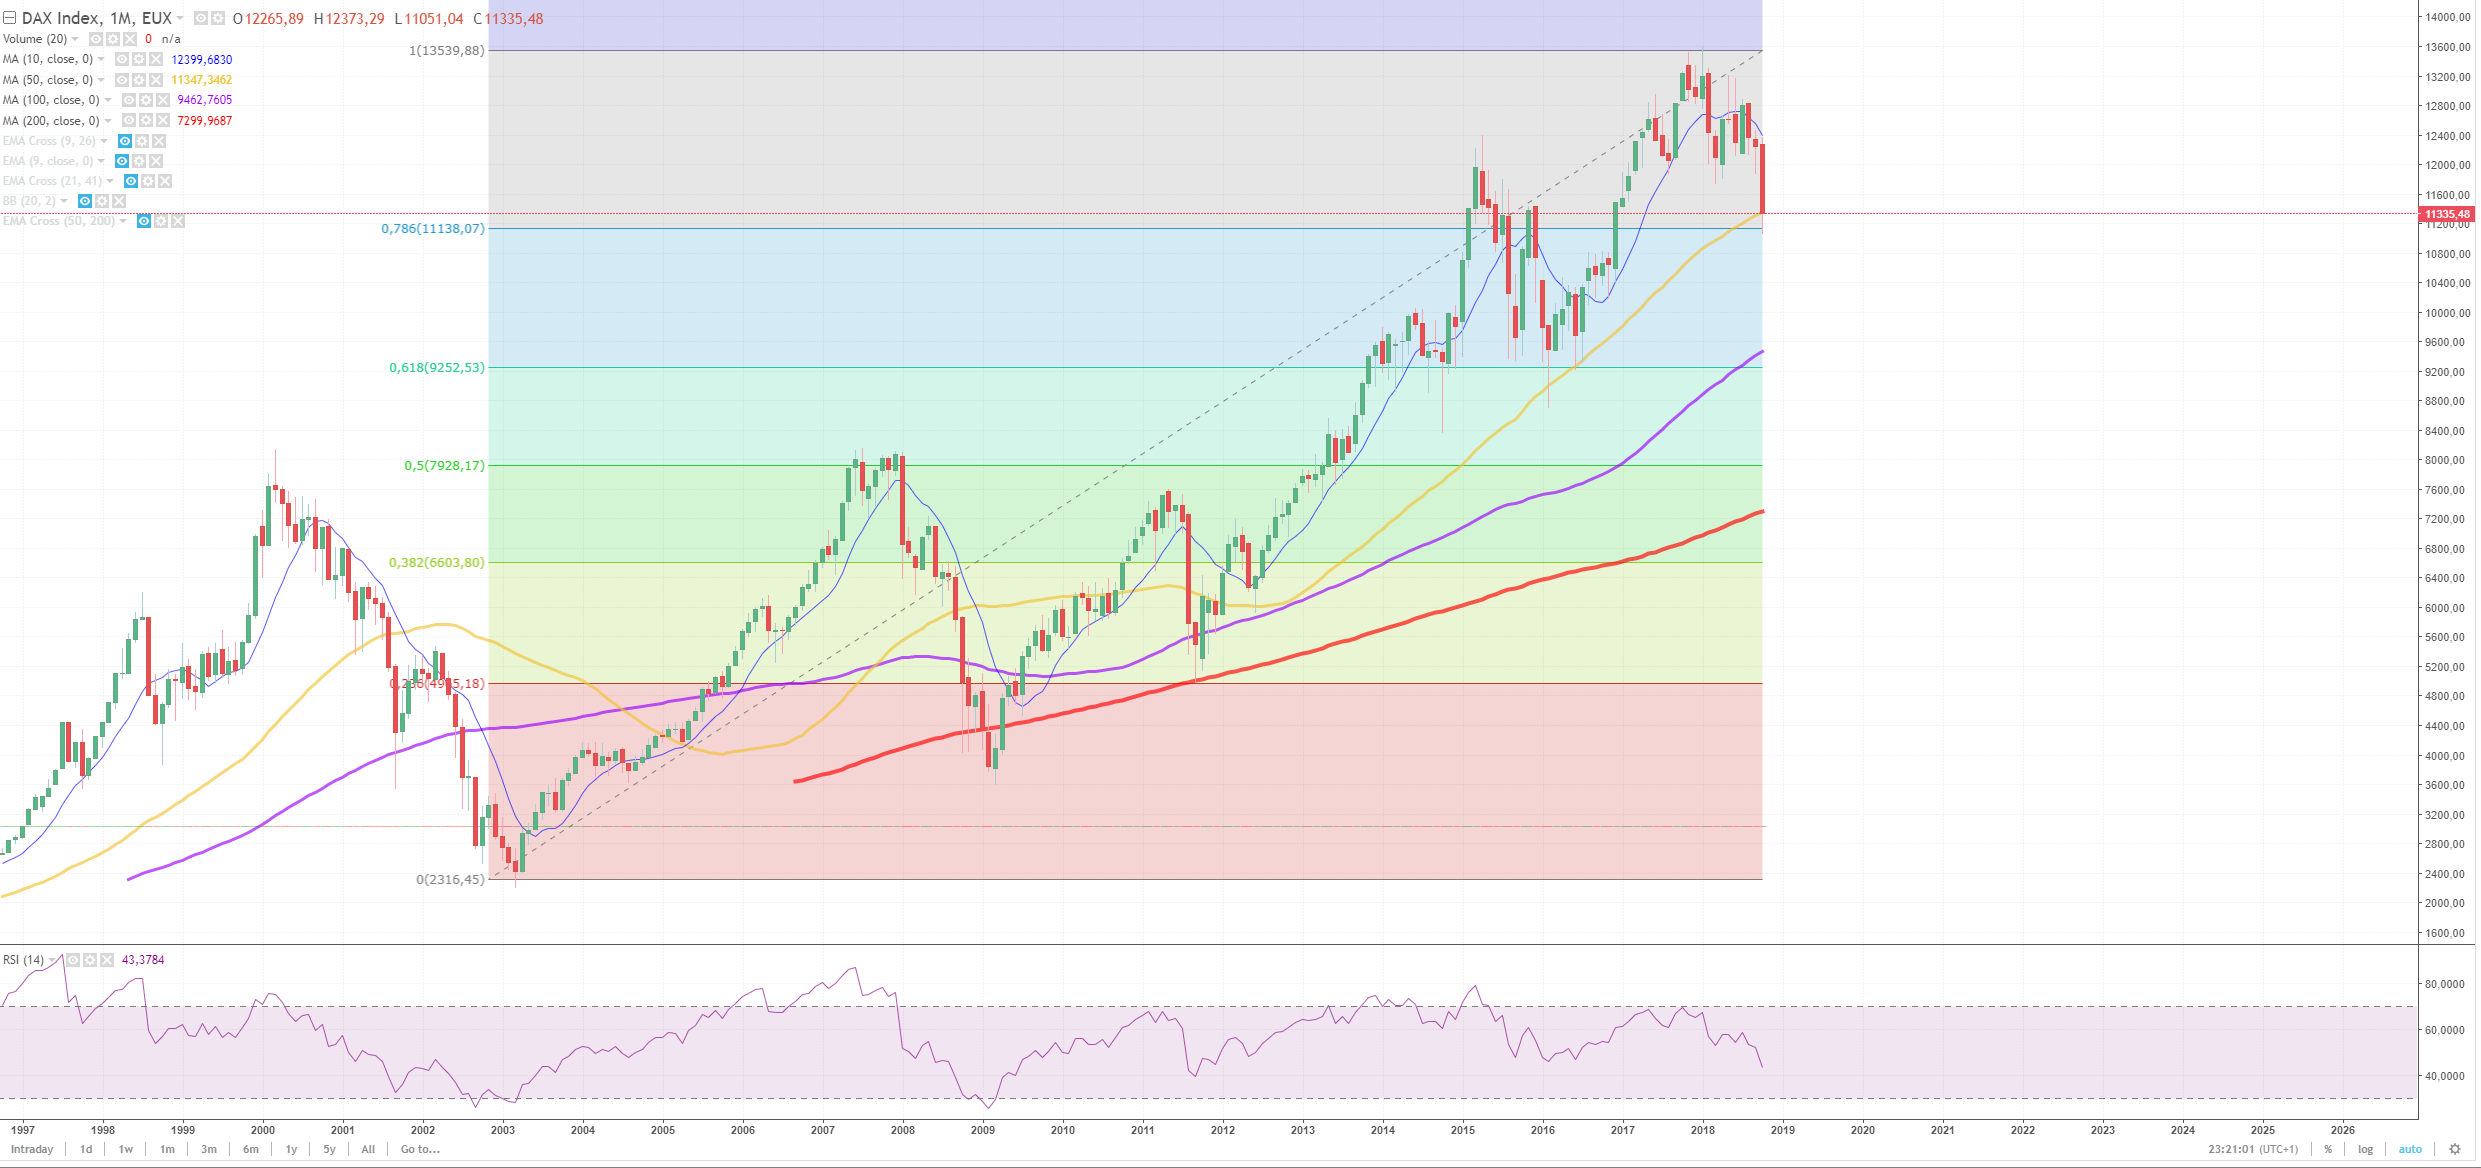
The fibonacci lines show us some potention support/resistance area's. fibonacci is not an accurate indicator!
Montly bottem was around the 78,6% retracement. Now holding it's own on the ma50.
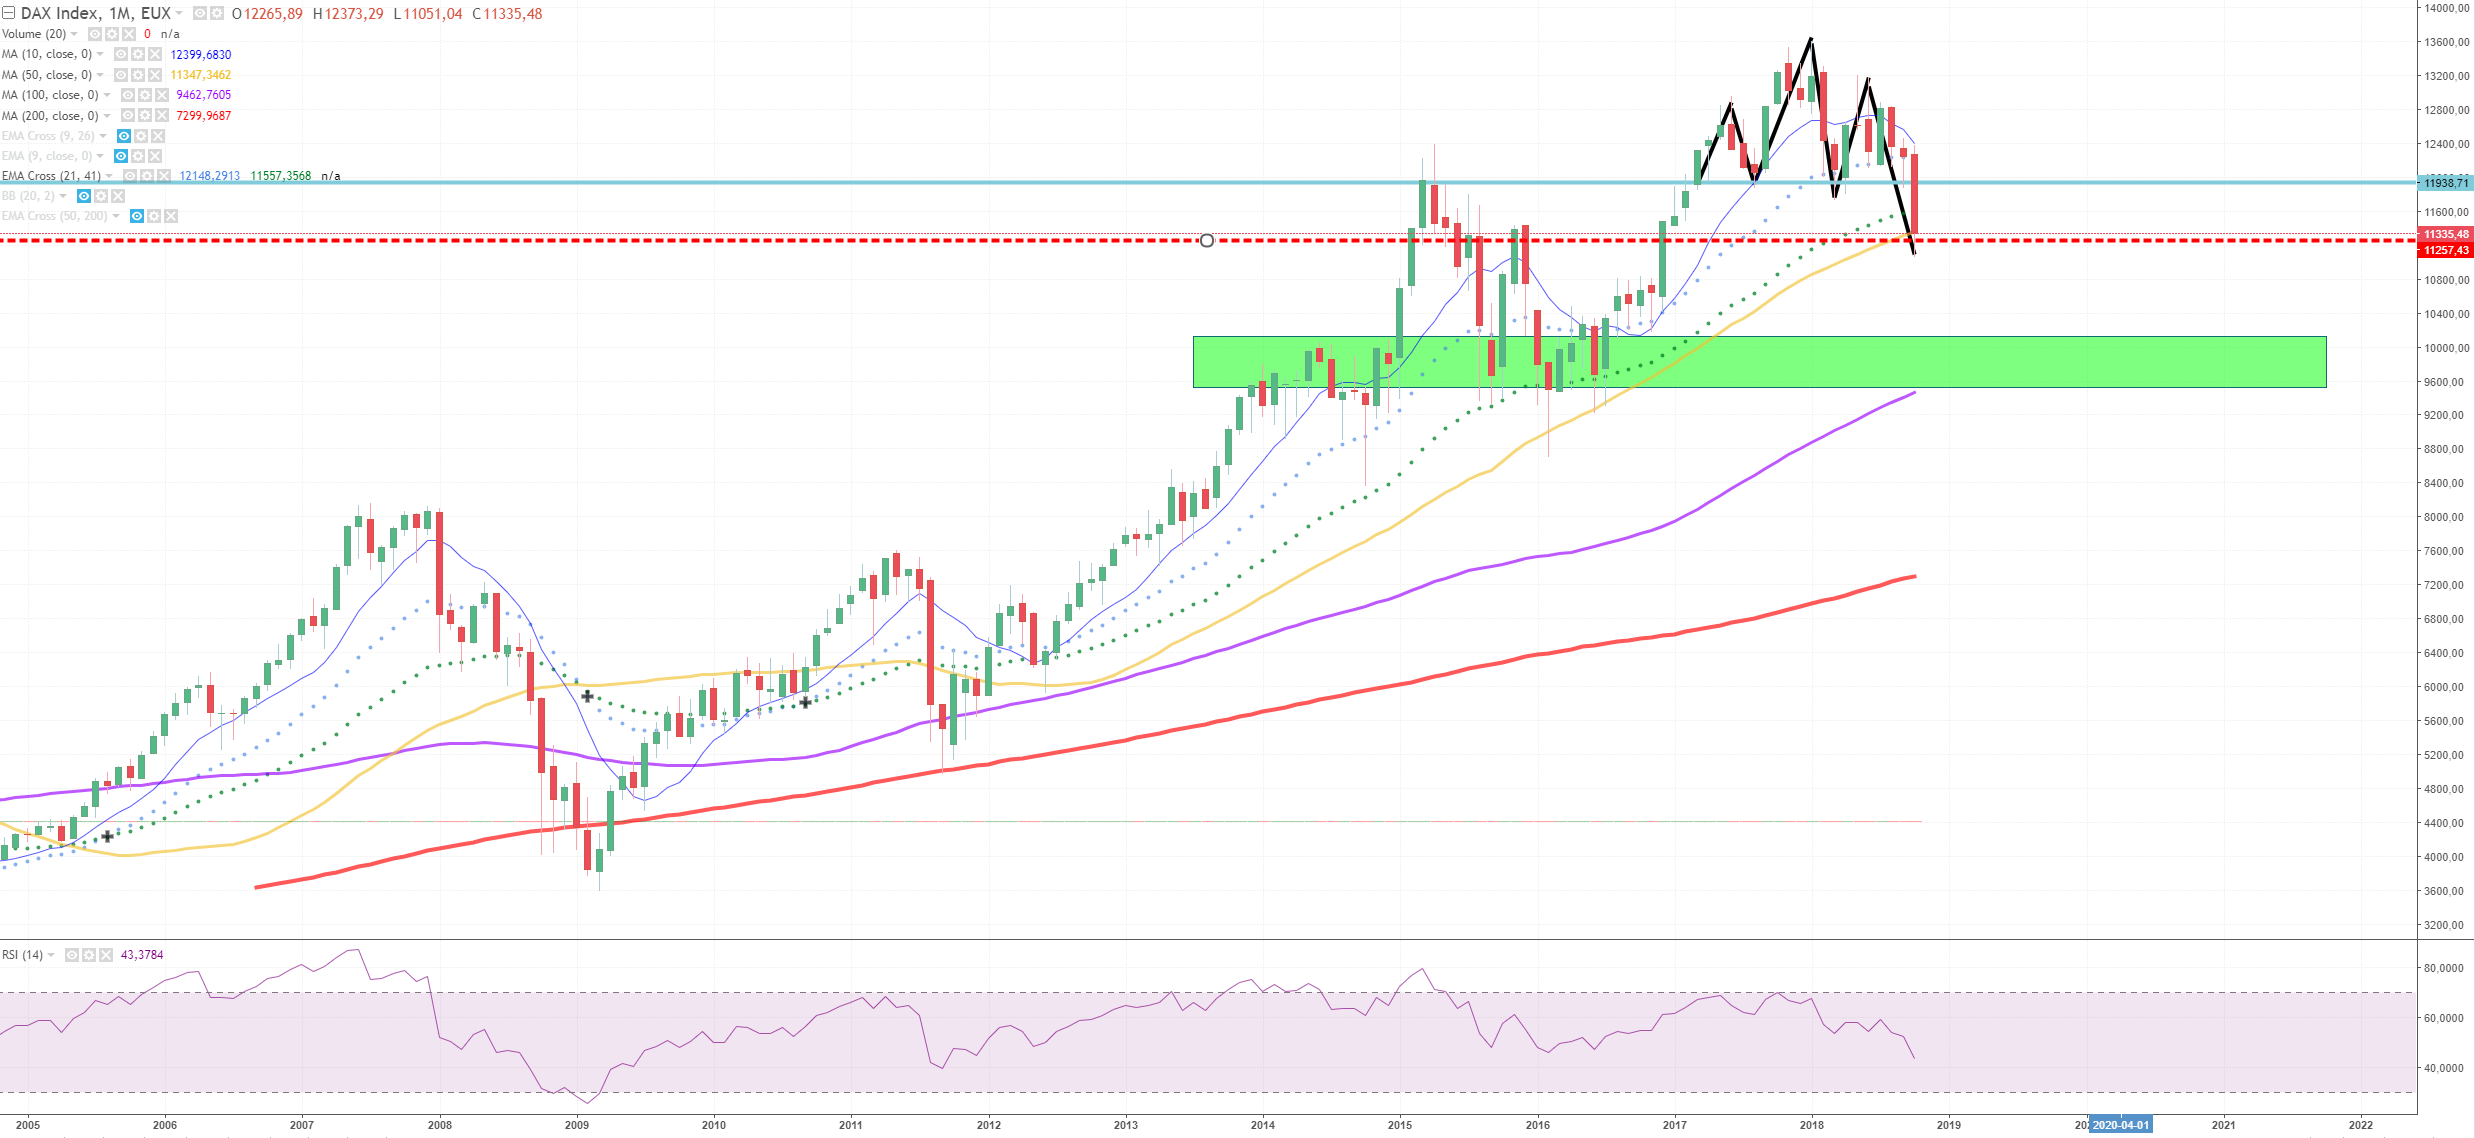
We also confirmed our head & shoulders pattern and broke through our previous top.
Tonight the Nasdaq and Dow Jones did have some losses causing the DAX to fall to 12257 (red dotted line)
We may see some support in the green area, which also corrosponds with our fibonachi level.
Also the dotted ema lines (ema21/41) are showing some bearish signs. 2 candles underneath the brown ema 41, will likely result in a bearish signal, eventually causing an ema cross, which is a very bearish signal.
RSI will likely go below 40, we can recover if we fall <40 and eventually recover >40 to go bullish (this could take quite some time).
1W
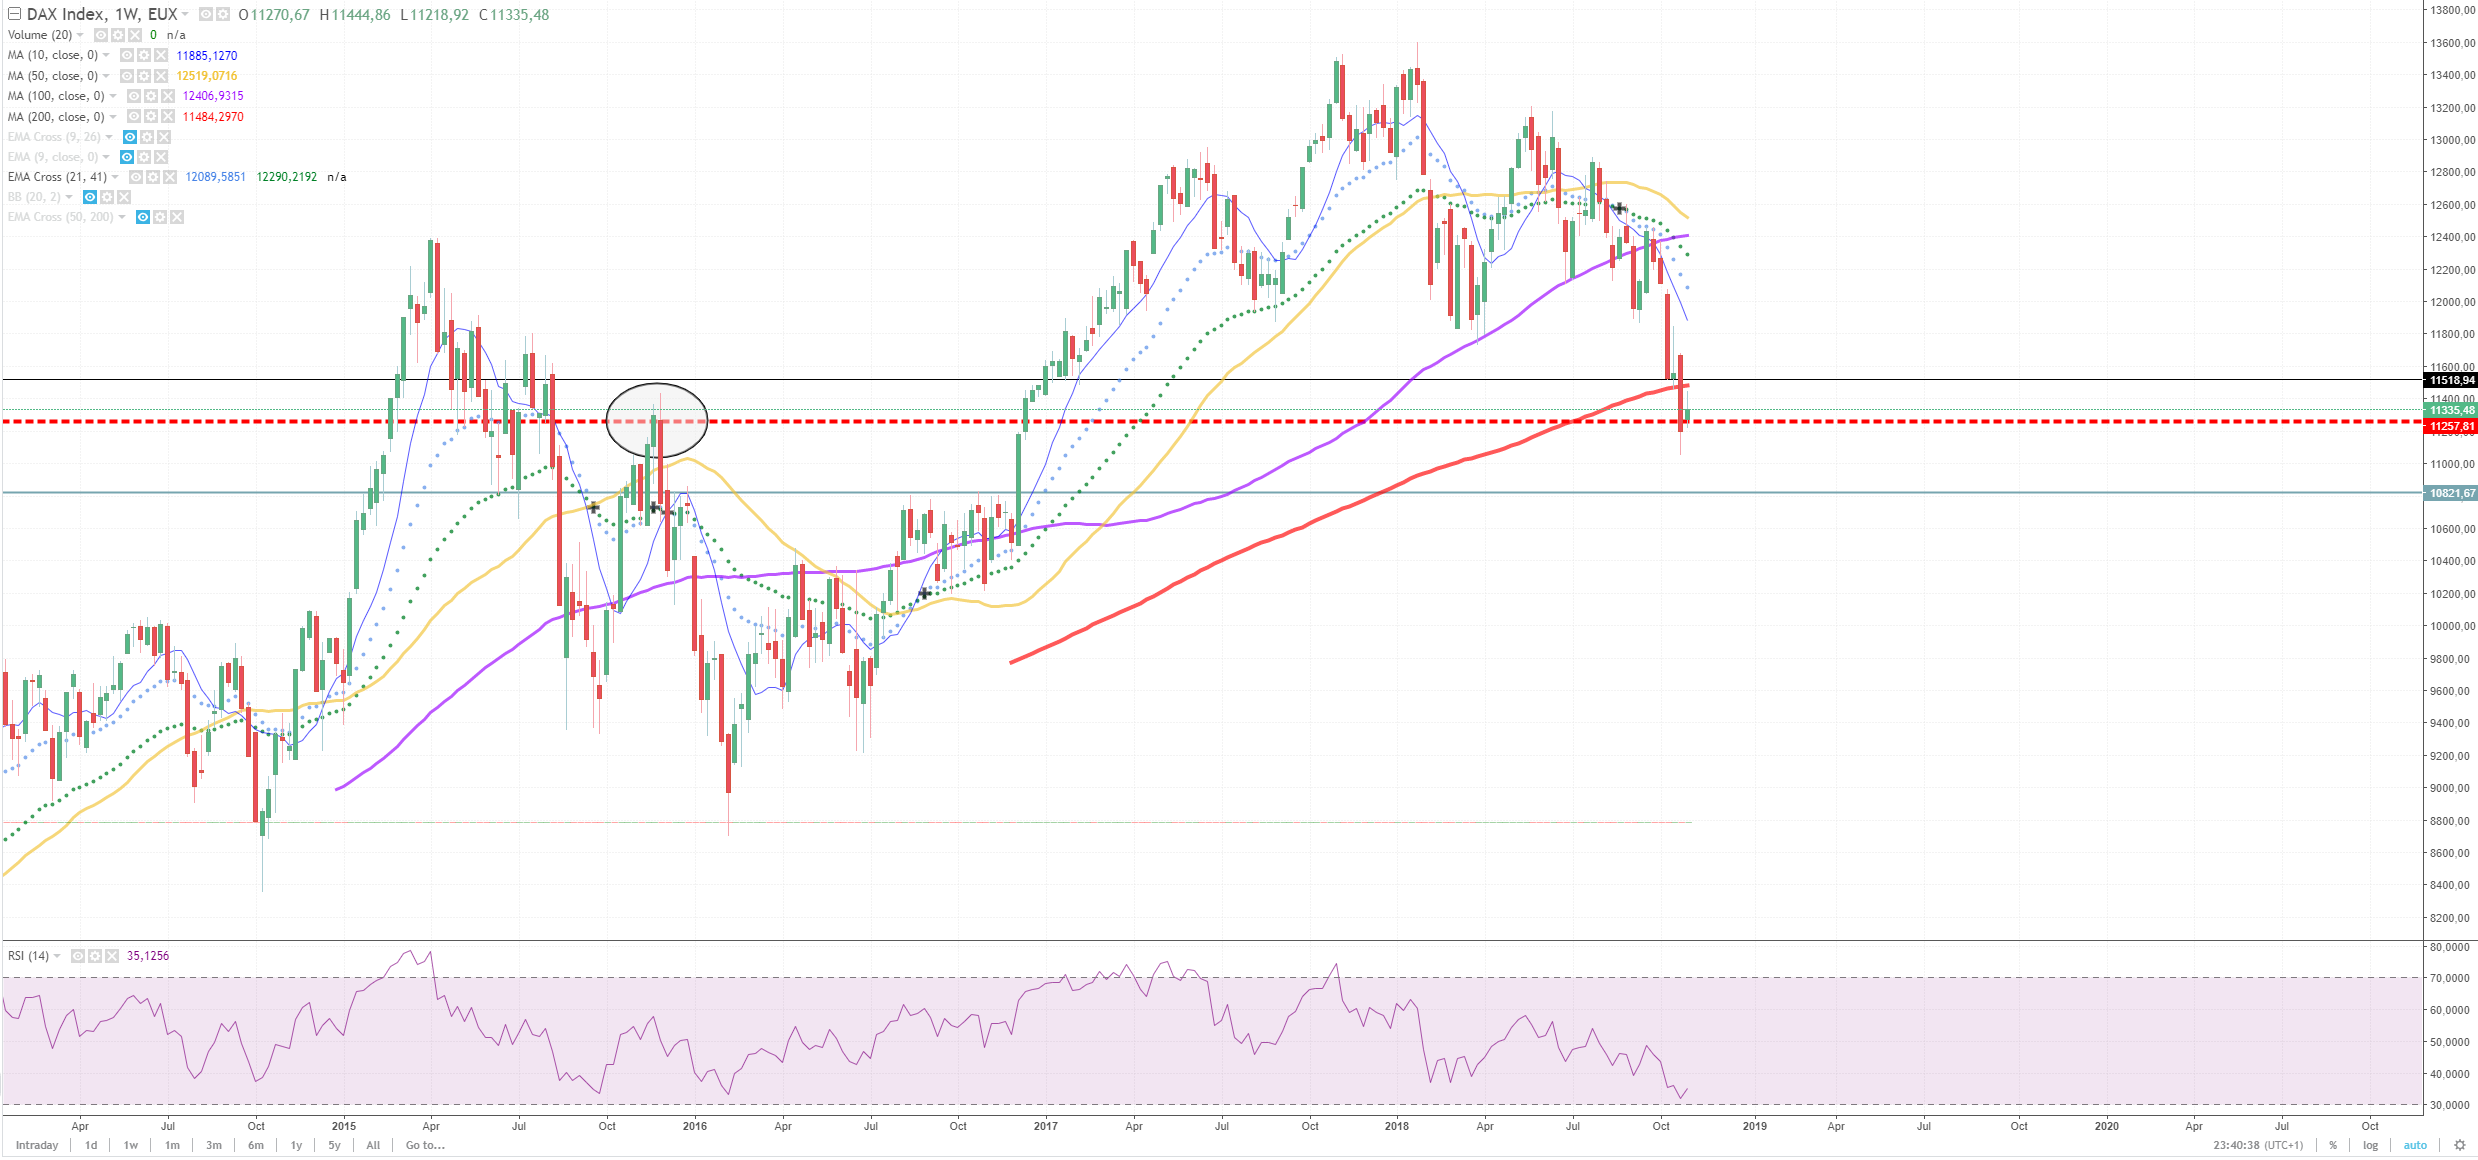
At this point there is some support at an old top.
At most we could bounce up to the ma200 (red) line, which could fall together with some old resistance points.
I'ts more likely to fall down, also because other markets are pulling the DAX down with them.
The ma50 (yellow)is likely to break through the ma100(blue)which will result in a bear trend, also because of the 70 degreesimpact on the blue line.
Also an ema21/41 cross is formed last times this happend was in 2015 resulting in a big crash.
Also the ma10 could show some recovery but a quick recovery to that point looks a bit too extreme for now.
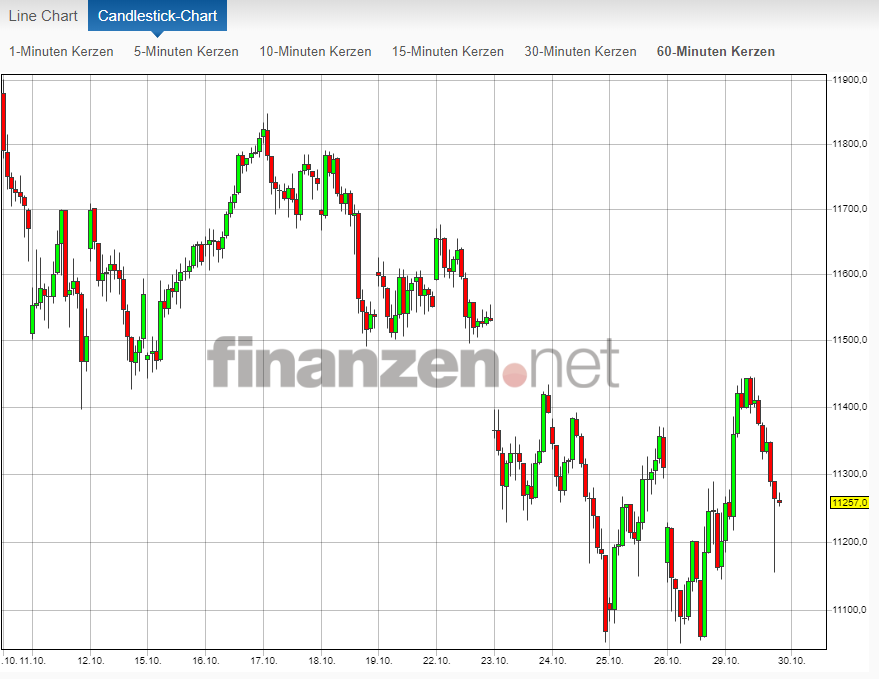
1D
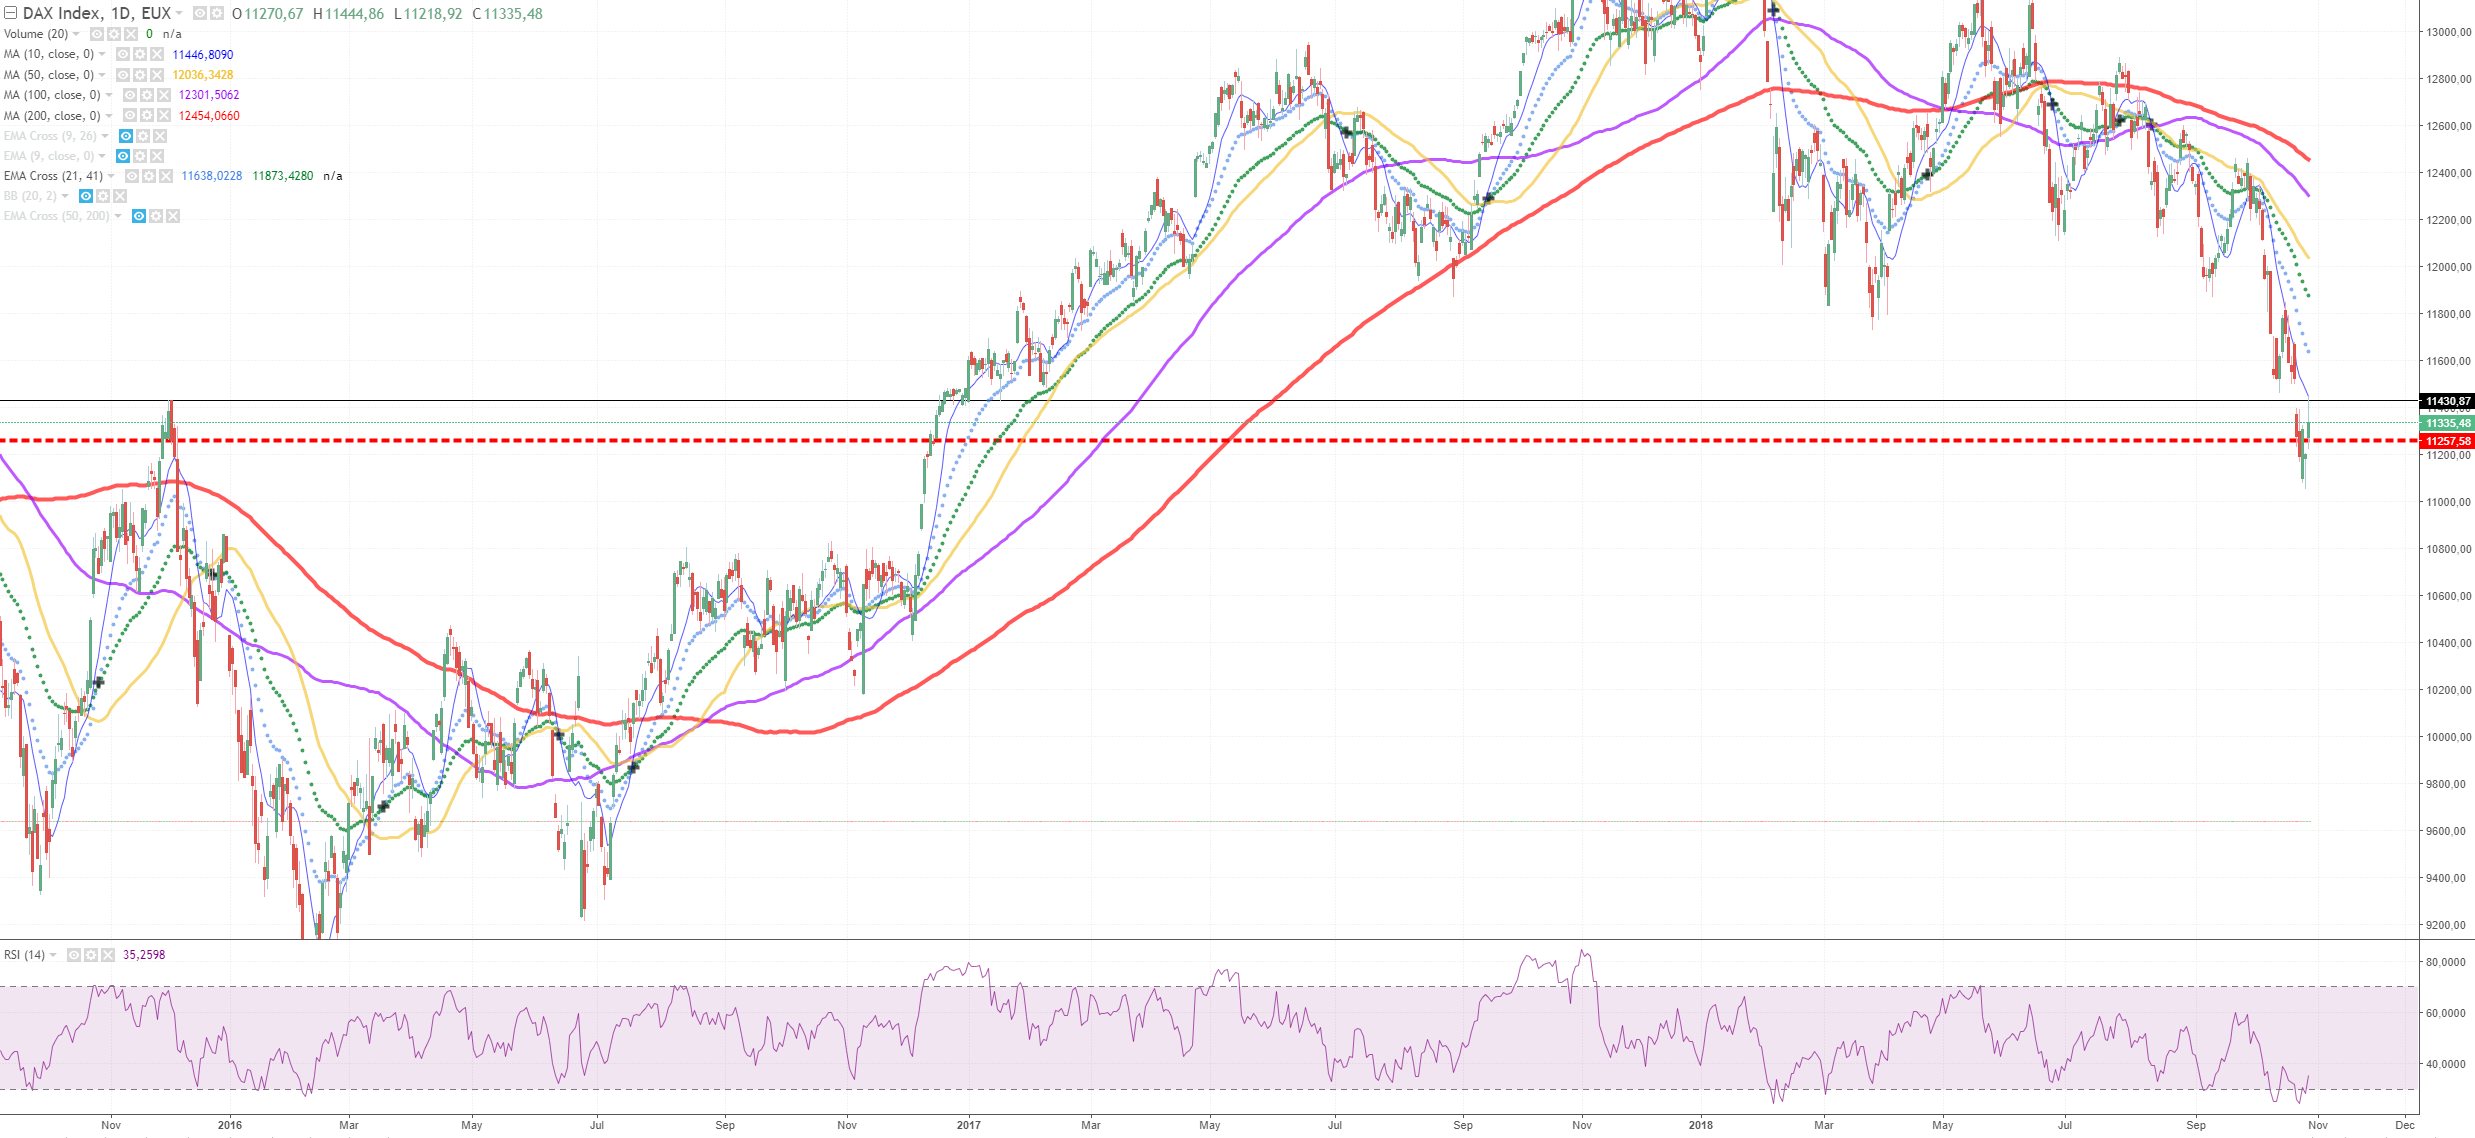
For the day-chart we can't find some quick resistance previous year.
We touched the ma10 shortly. The ma10 was also on par with the top mentioned on the weekchart.
We also the the ema cross here. And the ma10<ma50<ma100<ma200 which means that we're in a bear market and having some downward momentum.
4H*
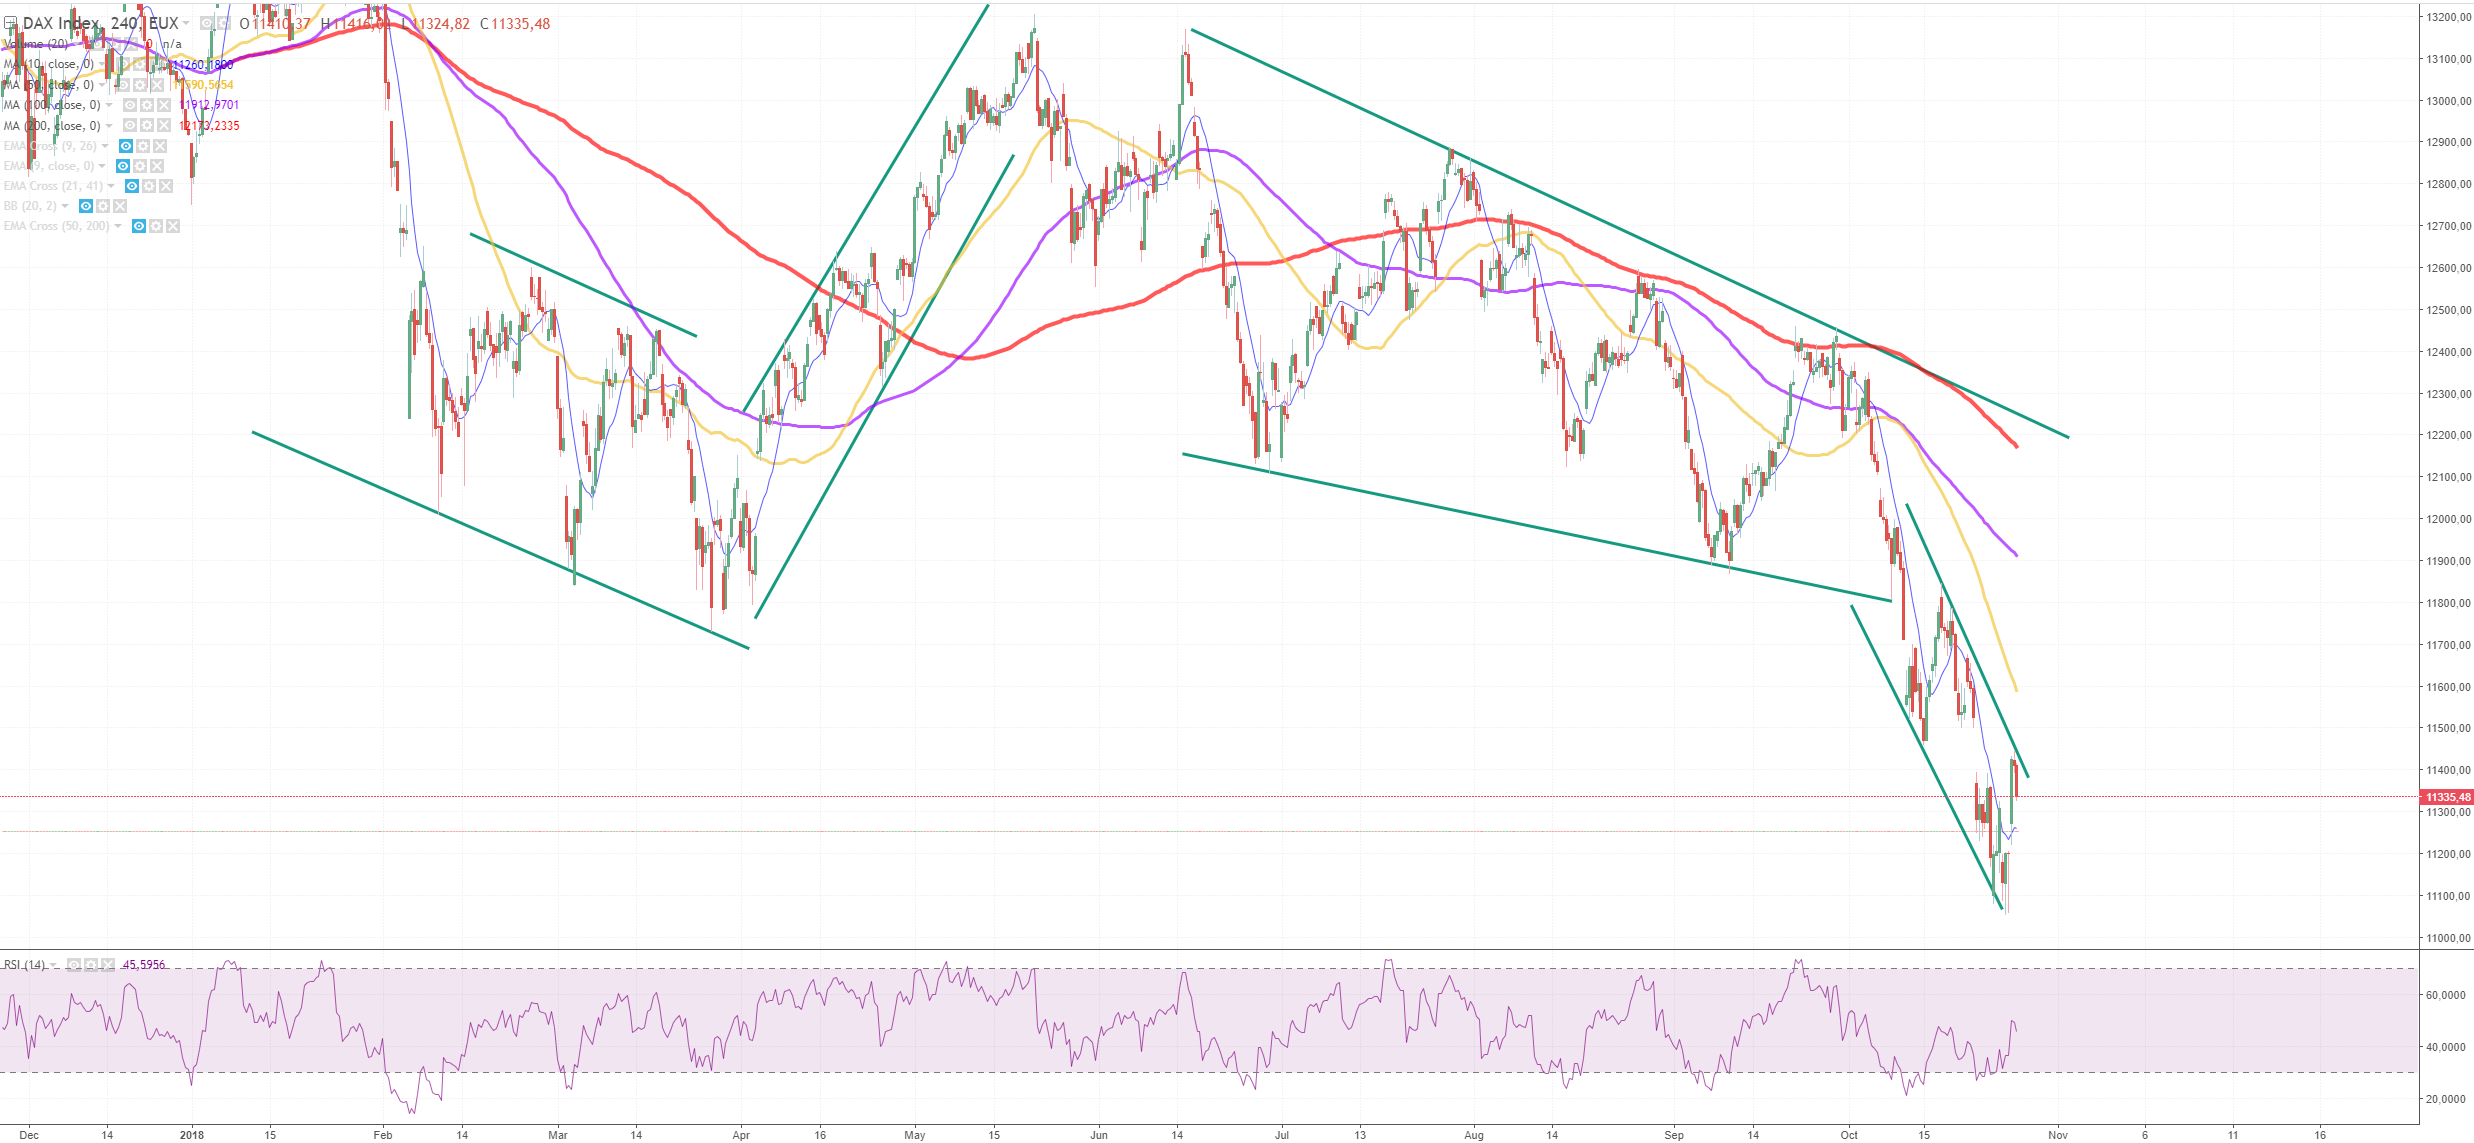
The channels are showing us that the downward trend is getting a huge momentum. And at this point we're going to the downside of this channel again.
Likely we will see some correction after this huge fall. Probably to the ma50yellow or ma100(blue) which will likely fall together with some previous giving resistance or ma10/ma200 on a higher time-frame chart.