10 Open Source and Free Data Visualization Tools
1.FineReport

FineReport is a data visualization tool free for personal use, which supports visualizing your data into reports and dashboards.
FineReport provides more than 19 categories and 50+ styles of HTML5 charts. These charts are self-developed and can be shown on different sizes of screens. You can transform your data into these stunning charts via simple drag and drop.
Besides, data visualization in FineReport has distinct dynamic and interactive effects. You can use interactive highlighting, series interaction, scaling, and automatic refresh to do interactive analysis.
Another stunning feature of FineReport is real-time visualization. You can write your data back to the database through the data entry feature and visualize the latest data.
Category: Reports and Dashboards
2. D3.Js
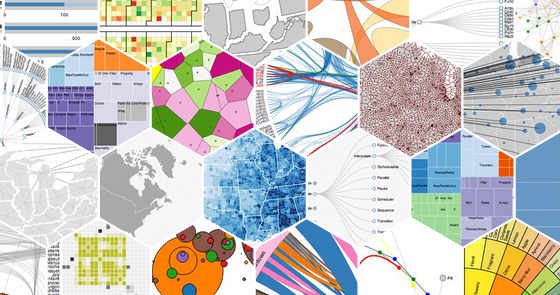
D3.Js is an open-source JavaScipt Library for using HTML, SVG, and CSS to create a data visualization, which can also be applied with Python or R. By combining graphical elements and arbitrary data to a Document Object Model (DOM), it is efficient to manipulate data.
D3 is the best chart gallery and is highly flexible. It supports large datasets and dynamic behaviors for interaction and animation. And it is easy to debug using the browser’s built-in element inspector
However, D3 requires users to have programming skills, and it takes a lot of time initially for newies.
Category: charts and graphs
3. Plotly
Plotly is an open-source, browser-based, and interactive data visualization tool, built on top of the d3.js visualization libraries.
You can create multi-chart visualizations when comparing datasets.
The complex charts generated by Plotly can be smoothly displayed on the dashboard and websites. These charts are fully interactive. You can hover, zoom, and pan these charts.
Besides, Plotly can be installed on premised or be deployed in the cloud. You can work in both online or offline mode.
However, Plotly does not support jQuery, and it needs the API key and registration when installing.
Category: charts and graphs
4. ggPlot2
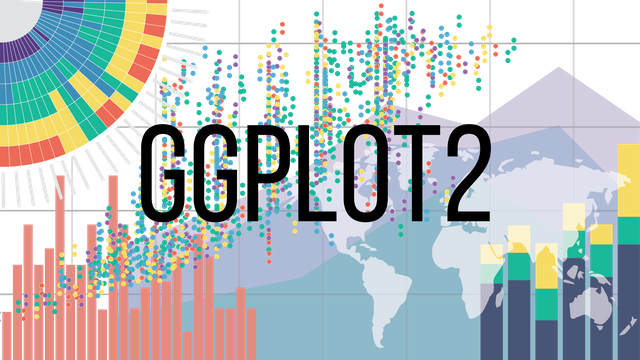
ggplot2 is a free data visualization package for the language R. The idea of ggplot2 is similar to architectural thinking, making the drawing according to layers. Compared to other free data visualization tools, ggplot2 allows you to approach your graph from a visual perspective instead of a programming perspective. It is easy and quick to make plots involving mountains of data. Besides, you can build complex charts by defining various underlying components and simple functions.
The disadvantage is some text in ggplot2 graphs is too small, and the labels are unclean; you need to modify it manually.
Category: charts and graphs
5. RawGraphs
RAWGraphs is a free data visualization framework that builds a link between spreadsheets and vector graphics editors, making it easy to visually express complex data.
Through RawGraphs, you can import data from Excel, Google Spreadsheets TextEdit, and other data sources, and then generate charts.
Importing the data is as simple as a copy-paste. And you can visualize the data form delimiter-separated values such as CSV and tsv files. Although RawGraphs is a web app, the data security is guaranteed because the Data inserted to RAW is handled only by the web browser.
The disadvantage is that you need your developers’ help if you want to custom the advanced charts.
Category: charts and graphs
6. Leaflet

Leaflet is a lightweight and free Javascript library for visualizing interactive maps, weighing just about 38 KB of JS. But it has almost all the features that the developers need to generate maps. You can implement interactive features such as multiple maps scaling and keyboard navigation. And the map can be shown on the PC and mobile devices. To customize the maps, users can use the APIs to develop. And the documentation is well structured that provides rich examples and tutorials.
The only disadvantage is the core functions only support the GeoJSON format.
Category: maps
7. PowerMap
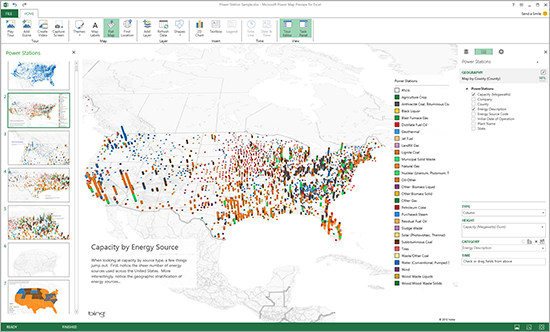
Powermap is a free Excel plugin that provides Bing Map visualizations and is used to map geographic data. It is easy to transform the Excel data into maps; even non-technical users can plot data on a 3-D globe or custom map without coding, including the geographic and temporal maps
The cons are weak interactive features. You can not filter data or drill down in Powermap. And custom shapes are unavailable.
Category: maps
8. OpenLayers

OpenLayers is an open-source JavaScript library professional in dynamic maps. It supports multiple GIS formats such as GeoJSON, GeoRSS, KML, GML. It also supports different Geo data sources using OGC-standards as WMS or WFS.
Another strong characteristic is power and flexibility. The library provides all the demanded features in the core functionality.
However, compared to other map visualization tools, OpenLayers requires more code, and it takes more time for newbies to start.
Category: maps
9. Gephi
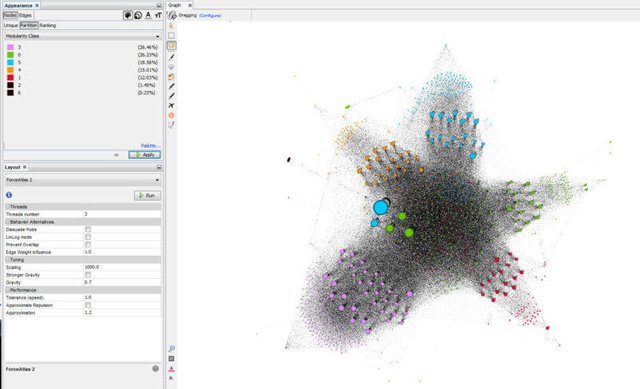
Gephi is a free data visualization tool that is professional in network analysis and visualization. It provides a user-friendly interface that users can quickly learn without much time. Besides, once loading and mapping the correct data, Gephi generates a graph automatically. The distinctive advantage is the interactive feature; you can zoom in, select nodes, adjust node size and color, find shortest paths, and access nodes and edges’ attributes.
However, Gephi only supports exporting the charts into an image and HTML document.
Category: network visualizations
10. Keyline
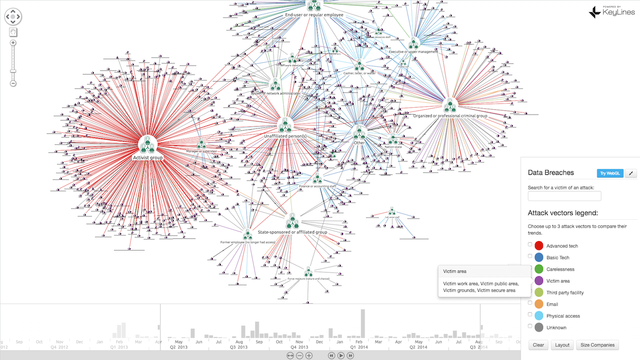
Keyline is a lightweight JavaScript toolkit that using HTML5 to visualize the network. It supports extracting data from any database and displaying your design on any browser and device.
Keyline provides eight automatic graph layouts that you can detangle links to reveal patterns and anomalies. And you can filter network, combine node, analyze the social network.
Category: network visualizations
Original Source: https://www.finereport.com/en/data-visualization/free-and-open-source-data-visualization-tools.html