Best Data Visualization Software in 2020
I collected 20 Best Data Visualization Tools with their pros, cons, and suitable crowd. To help you faster find the data visualization software, I categorized these tools into different types. And the list contains both open-source(free) and commercial(paid) software.
Data Visualization Software–Commercial
1.BI and Reporting
1) PowerBI
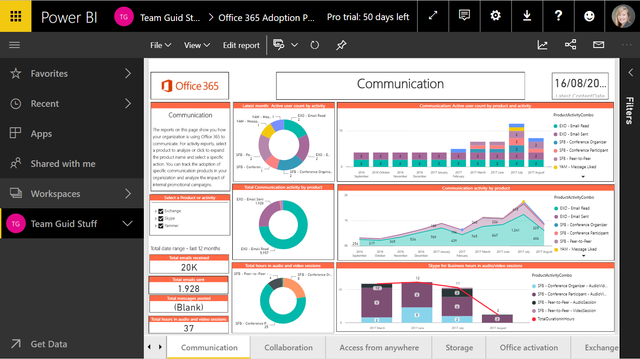
PowerBI is a BI tool that takes the Excel pivot table to the next level.
Pros:
- Short learning curve since the UI is similar to Excel
- PowerBI can seamlessly integrate with Ms office since power BI is developed by Microsoft.
- PowerBI supports using R to present advanced data shaping and analytics, such as forecasting.
- It does not support enterprise-class control, which may cause authority management issues.
- The free version has a limit on the amount of data.
2)FineReport
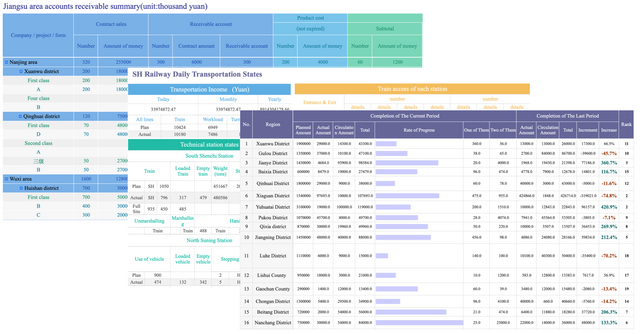
FineReport is a reporting software while being distinct at data visualization, primarily visualizing your data via reports or dashboards with impressive HTML5 charts, including 3d and dynamic effects. It is viewed as best crystal reports' alternatives.
Pros:
- Data entry feature makes it easy to input massive data via forms directly into databases. In this way, it is convenient to visualize real-time data.
- The capacity for making complex reports is impressive. You can drag&drop to create outstanding irregular reports.
- FineReport is flexible to integrate with various business systems so that visualizing the data in other systems is easy.
- To realize multi-dimension visualization, you need to create a report for each dimension.
- Although it provides a wealth of visual effects, charts, maps, 3D effects, it does not recommend charts according to the data. You should choose the charts by yourself.
3) Tableau
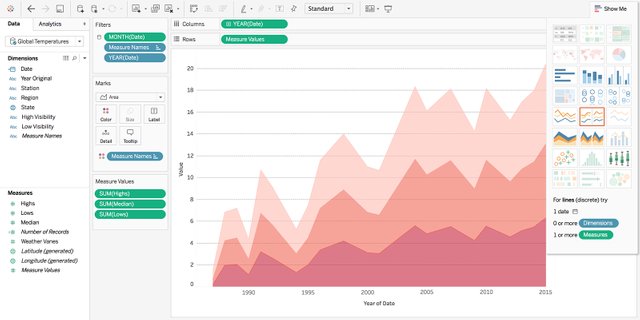
Tableau may be the most famous BI and data visualization software around the world.
Pros:
- The community is awesome, where you can find many data visualization showcases created by Tableau users.
- Data visualization capabilities are unparalleled. The Tableau development team is working on exploring what types of charts users prefer so that Tableau can display the best graphs for the data.
- It does not offer 3D charts and no custom visual imports.
- Tableau is almost closed. Therefore, it is hard to customize or embed it into companies’ IT landscape.
2.Charts and Graphs
4) Datawrapper
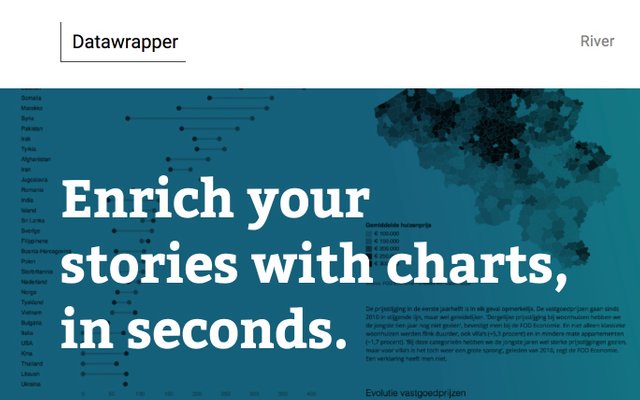
Datawrapper is an online data visualization software requires no coding and design skills.
Pros:
- All the charts are available as a responsive iframe, PNGs, SVGs, or as print-ready PDFs with defined CMYK colors.
- No code or design skills needed
- It can be complex to store data on your server
- It is better for a small amount of data
5) Chartblocks
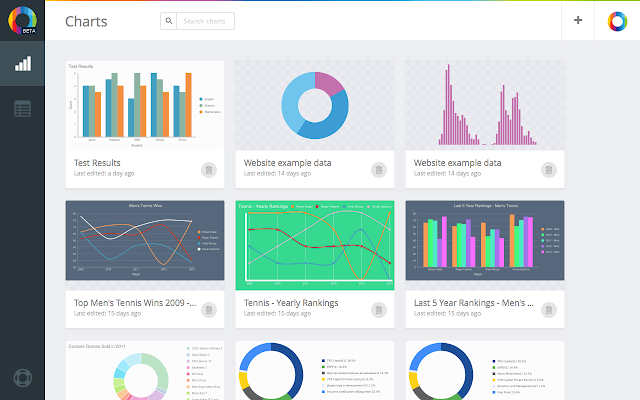
Chartblocks is an online chart building tool that allows users to import data from different sources, customize charts, design, and share charts all within minutes.
Pros:
- You can import your data instantly.
- It supports you to control almost every aspect of your chart
- It offers hundreds of customization options.
- The amount of data you can upload is rather small
- On the free version, you can only do a few charts at a time
- The export quality isn’t the best on the free version
3.Infographics
6) Piktochart
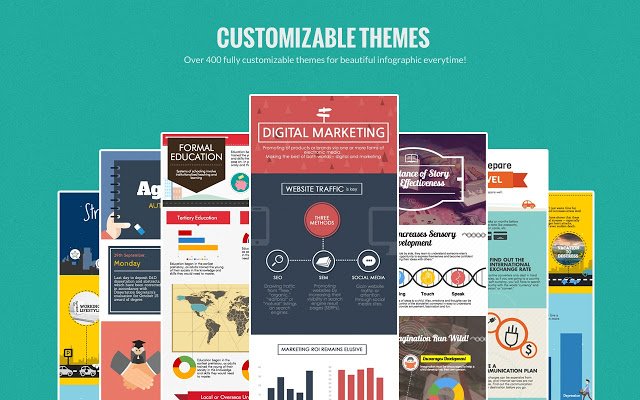
Piktochart is a web-based data visualization software designed to make infographics.
Pros:
- You can import and organize data into a mini spreadsheet from Google Drive, SurveyMonkey, and Excel.
- Support download ad blocks
- It offers a wealth of free infographics to use within your creations.
- There are no rich media (HTML5) export options
- Unable to search the infographic templates based on topic, tags, or design.
7) Visme
Same as Piktochart, Visme provides rich infographic templates that are available in both paid and free options.

Pros:
- Visme provides keyword search function so that you can find the template types you want quickly.
- You can create interactive and animated infographics in Visme.
- Changing, cloning, and moving the sections in Visme isn’t as easy as it is in Piktochart.
- It takes longer to learn compared to other infographics software.
Suitable crowd: non-technical users
4.Maps
8) Mapbox
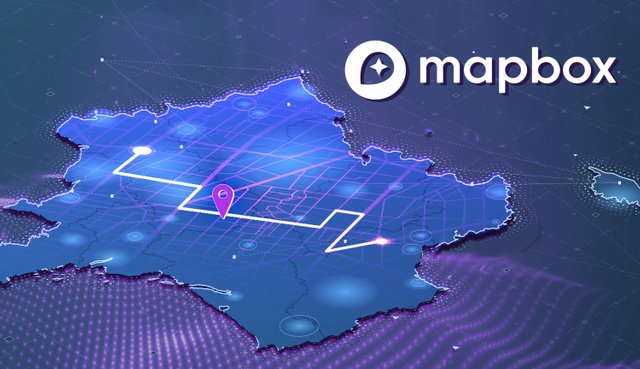
Mapbox is a mapping platform for designed maps. The APIs and SDKs are the building blocks to integrate location into any mobile or web app.
Pros:
- The data loading is speedy due to custom tile generation
- Standardized data flow for large organized projects
- The System is too complicated for simple projects or maps
- It has a steep learning curve for developers used to other APIs
5.Networks
9) Keylines
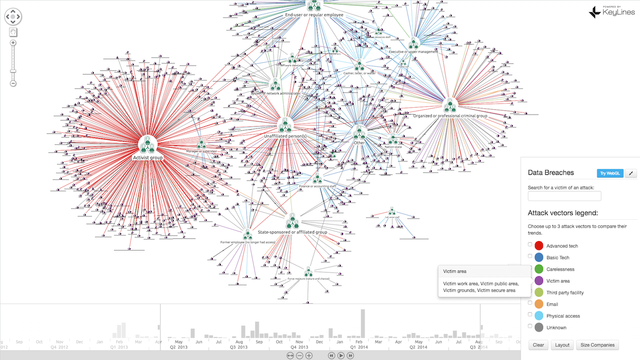
Keylines is a lightweight JavaScript toolkit, using HTML to visualize the network.
Pros:
- It is compatible with all any browser, device, server, or database.
- It provides eight automatic graph layouts for detangling links to reveal patterns and anomalies.
- It allows users to filter networks, combine nodes, analyze the social network.
6.Stock Charts
10) StockCharts.com
StockCharts.com is a web-based charting and analysis platform that specializes in the stock charts.

Pros:
- It offers a wide variety of advanced charts and analysis from industry experts to analyze the stock.
- Ir provides excellent point and figure charts
- You can write your own scan criteria
- Charts are not dynamic and clunky
- Inability to zoom in and out
- Clumsy interface loaded with ads
To find free and open-source data visualization software: https://www.finereport.com/en/data-visualization/best-data-visualization-software-free-and-commercial.html