Today's Data Viz Collection #dataisbeautiful (15.12.2017)
Be sure to check in to #dataisbeautiful regularly and tag your viz' with it as well!

Not exactly beautiful, but mesmerising nonetheless how expensive and numerous presidential golfing can be.
Author: Sophie Germain
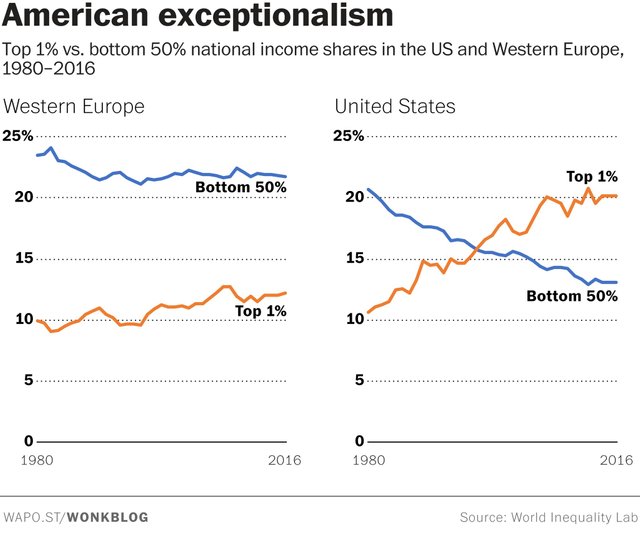
"It takes decades of deliberate policymaking to create trends that look like this."
Author: Christopher Ingraham for Washington Post
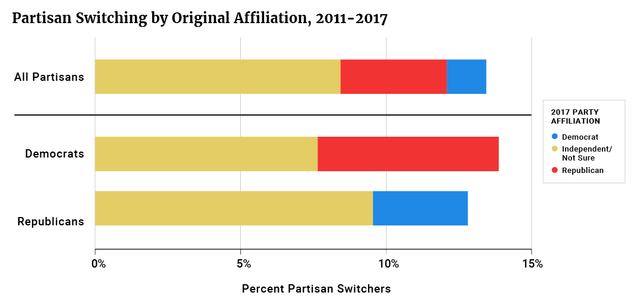
Understanding Voters Who Switched Partisan Affiliation
Author: Robert Griffin for VoterStudyGroup.org

"I created a website to visualize and quantify pros / cons for ANY Amazon electronics product, based on its user reviews. It enables readers to go through thousands of reviews in a few minutes."
Author: Rebecca Smithers for TheGuardian
Hey - fantastic idea - @zeroooc suggested I look you up - You might like my latest XMAS infographic attempt using Tableau - or people seemed to have liked this too: on microeconomics
I'm with you on promoting infographics. Anything I can do to help curate (no idea how shared curation works btw) lemme know, it's a new thing for me, but I love data vizes!
I do not know how to give you such a nice post, but also try to post something like yours, I follow your friends and vote for them, I always hope for your votes and comments. @salekbd