How to Read Candlestick Charts 101

Introduction
Today, I'll be starting a multi-part series to explain what candle sticks are and what different patterns signify. I'll start with the general characteristics of how a candlestick is structured and what the chart reflects.
In other posts, I will explain whether a particular pattern signals for a bullish or bearish market.

Background
A fun tidbit about the charts is that the invention of the candlestick chart originates from Japanese Rice Trading. In that time period, the price of rice was fluctuating rapidly and people could only speculate why. As a result of this confusion, the candlestick charts were invented as a way to keep track of price movements. However, traders have recently separated the "what" and the "why", and thus we have the following guiding principles:
-The “what” (price action) is more important than the “why” (news, earnings, and so on).
-All known information is reflected in the price.
-Buyers and sellers move markets based on expectations and emotions (fear and greed).
-Markets fluctuate.
-The actual price may not reflect the underlying value.
Moving on to the Basics

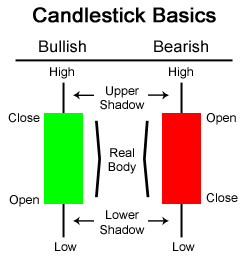
We'll keep this short and sweet and talk about the image above.
It's important to note that each candle represents a time interval such as 1 hour or 1 day. For the purposes of this instruction,
we'll assume that it represents one day.
The Green "Candle" signifies a price increase while the Red "Candle signifies a price drop.
Open: Refers to what the price was at the beginning of the time interval (1 day)
Close: Refers to what the price was at the time interval (1 day)
High: The highest point the price was in that time interval
Low: The lowest point the price was in the time interval
Thus, the "shadows" or "wicks" of the candle represent the range the price was in, but didn't end at.
Note that the Opens for the red candles are at the top and then the Closes are at the bottom because of a price drop.
Conclusion
Now you know how to read candle stick charts! The next step is applying this knowledge to actual trading applications! I'll discuss good buying and selling opportunities in my other posts.
If you want to tune in on my cryptocurrency adventures and listen to my advice then you can follow me @kyungjaechoo!
Thnx @kyungjaechoo for putting this info all together.
great work thans you very much . This will help me a lot in the analysis of charts