Cryptocurrency , BTC , ETH , XRP , BCH price analysis august 13

Among the top four cryptocurrencies, Bitcoin has taken the lead and marching ahead, making new highs the value of a lifetime, while others are still far from the peak. However, Bitcoin has attracted the entire universe of cryptocurrency along with it. The total market capitalization of 843 digital currencies has reached above $ 132 billion.
So, can these bullish trends continue or do we see other short-term corrections? Let's see what our chart pattern shows. We start with the leader - Bitcoin.
BTC / USD
Bitcoin ranges between $ 2,999.99 and $ 1,913.19 for about two and a half months. The escape from that range has a pattern target of $ 4,086.79, which has been achieved. We should see light consolidation or correction for one to three days at the current level before the uptrend continues.
 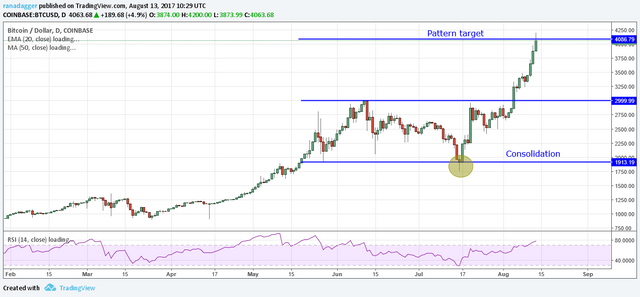
Therefore, traders who have positions from lower levels may want to book a partial gain at current levels. Avoiding fresh positions seems like a great idea until we see a small reflection or consolidation, which will give a good stop loss point.
However, if momentum continues and Bitcoin breaks through $ 4,086.79, then rally to $ 4,630.19.
ETH / USD
Ethereum is currently facing resistance at $ 323.69, which is above the 61.8 percent Fibonacci retracement level from the fall from $ 420 to $ 130.26; We are not considering the lowest point of the June 21 crash for this calculation.
 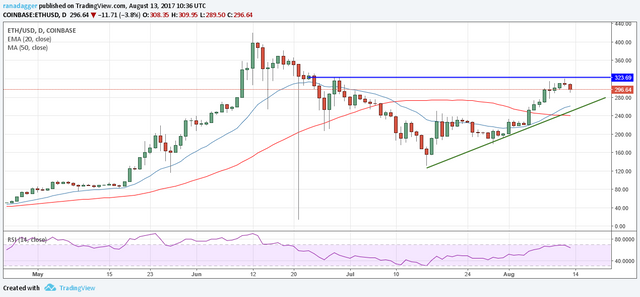
Current fall could reach $ 270, where the currency has double support - from trend line and 20-day exponential moving average (EMA). We can expect this level to last. Therefore, buying closer to the trendline with a stop loss just below it may offer a good entry point with little risk. The first target is $ 323.69, above which a move to $ 381 is possible.
If, however, trendline support breaks, down to $ 215 and $ 180 possibilities.
XRP / USD
A large descending triangle is formed on the daily chart of XRP / USD. The bearish pattern will end in a position to fall below $ 0.135. In the short term, however, there is support at $ 0.15460.
 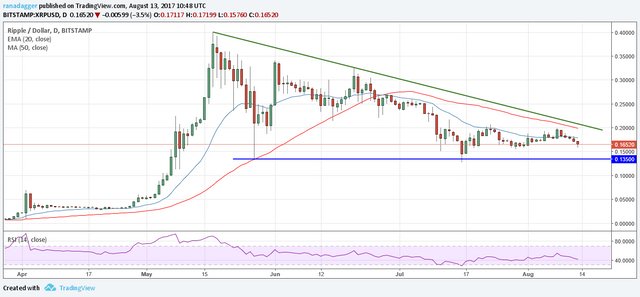
Nevertheless, as Ripple quotes below the average of a downwardly critical trend, traders should avoid taking a fresh long position until prices fall from the downtrend line at $ 0.20000 and start a new uptrend. Until then, it's best to stick with other currencies that follow a definite trend.
BCH / USD
After a few days of initial volatility, BCH / USD is currently declining. Since the currency has a short history, we have to use a 240 minute time frame on it.
 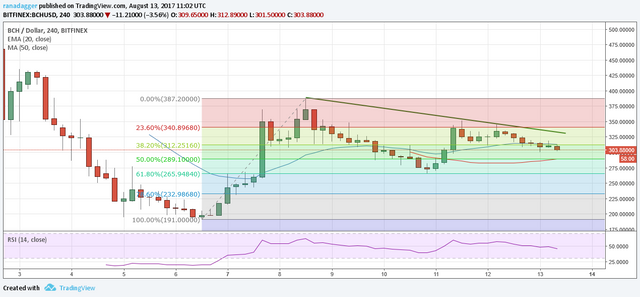
Currently, the price is moving down towards the support level of $ 280 and $ 265. The trend will change after the price descends from the downtrend line at the $ 330 level. Therefore, it is best to wait for the lower level to start a fresh position or wait for the breakout at Top of the trend line.
Always support @xiti account by follow @xiti and upvote post @xiti so that the information provided is useful to many people. agree?
Thanks for this price analysis @xiti
Thanks for sharing @xiti
Nice post, good informating @xiti
I agree with analysis of bitcoin.
keep posting such things.