EOS Showing Signs of Strength

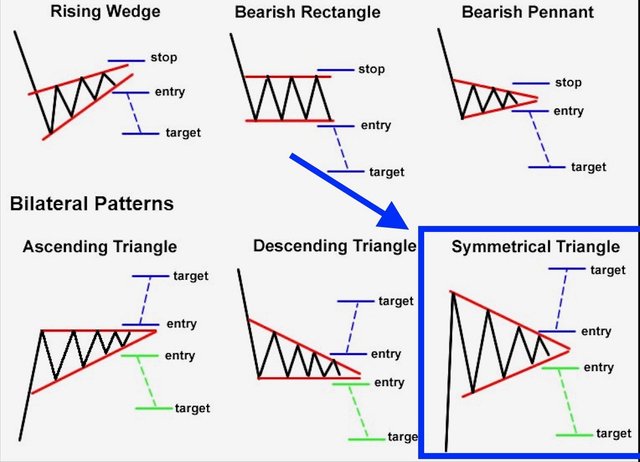
Looking at the 4 hour chart, we can see a symmetrical triangle has formed. This suggests a larger move up or down may be coming. As it moves closer to the apex, the more likely that move is to occur.
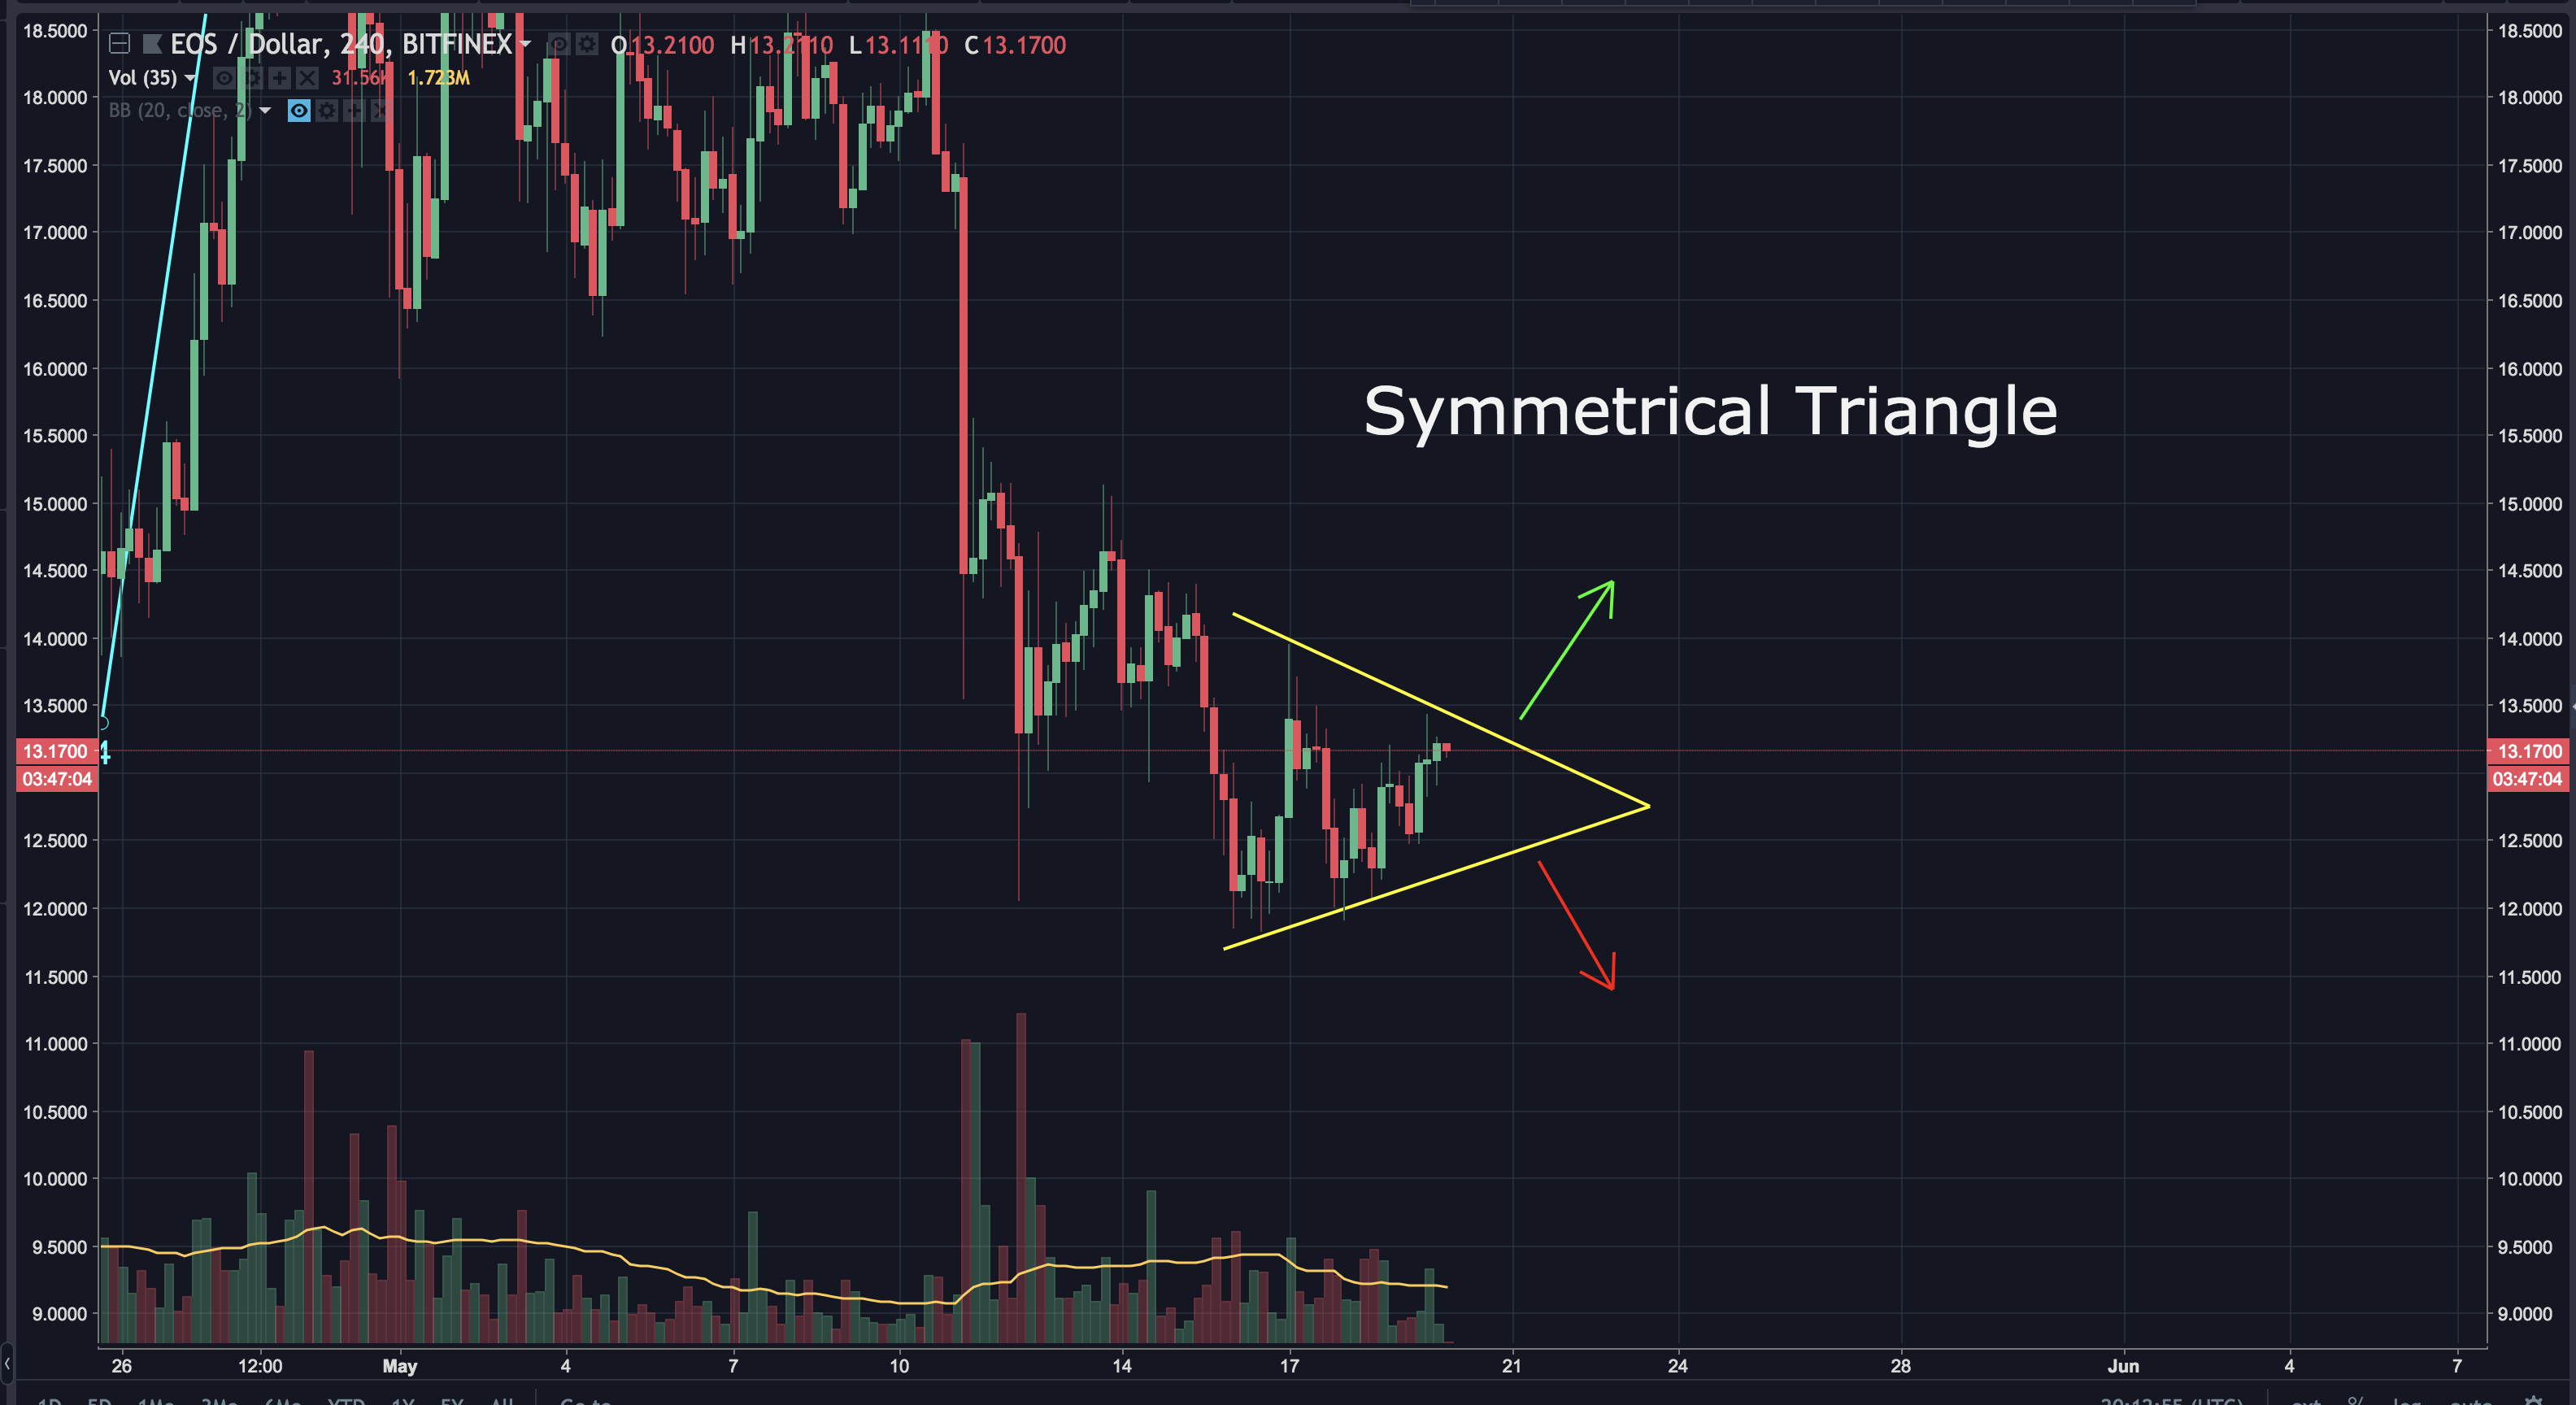
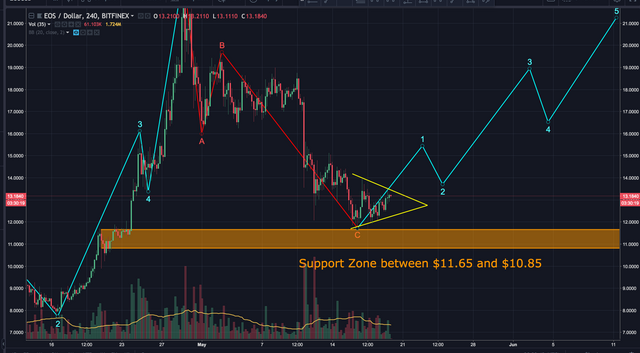
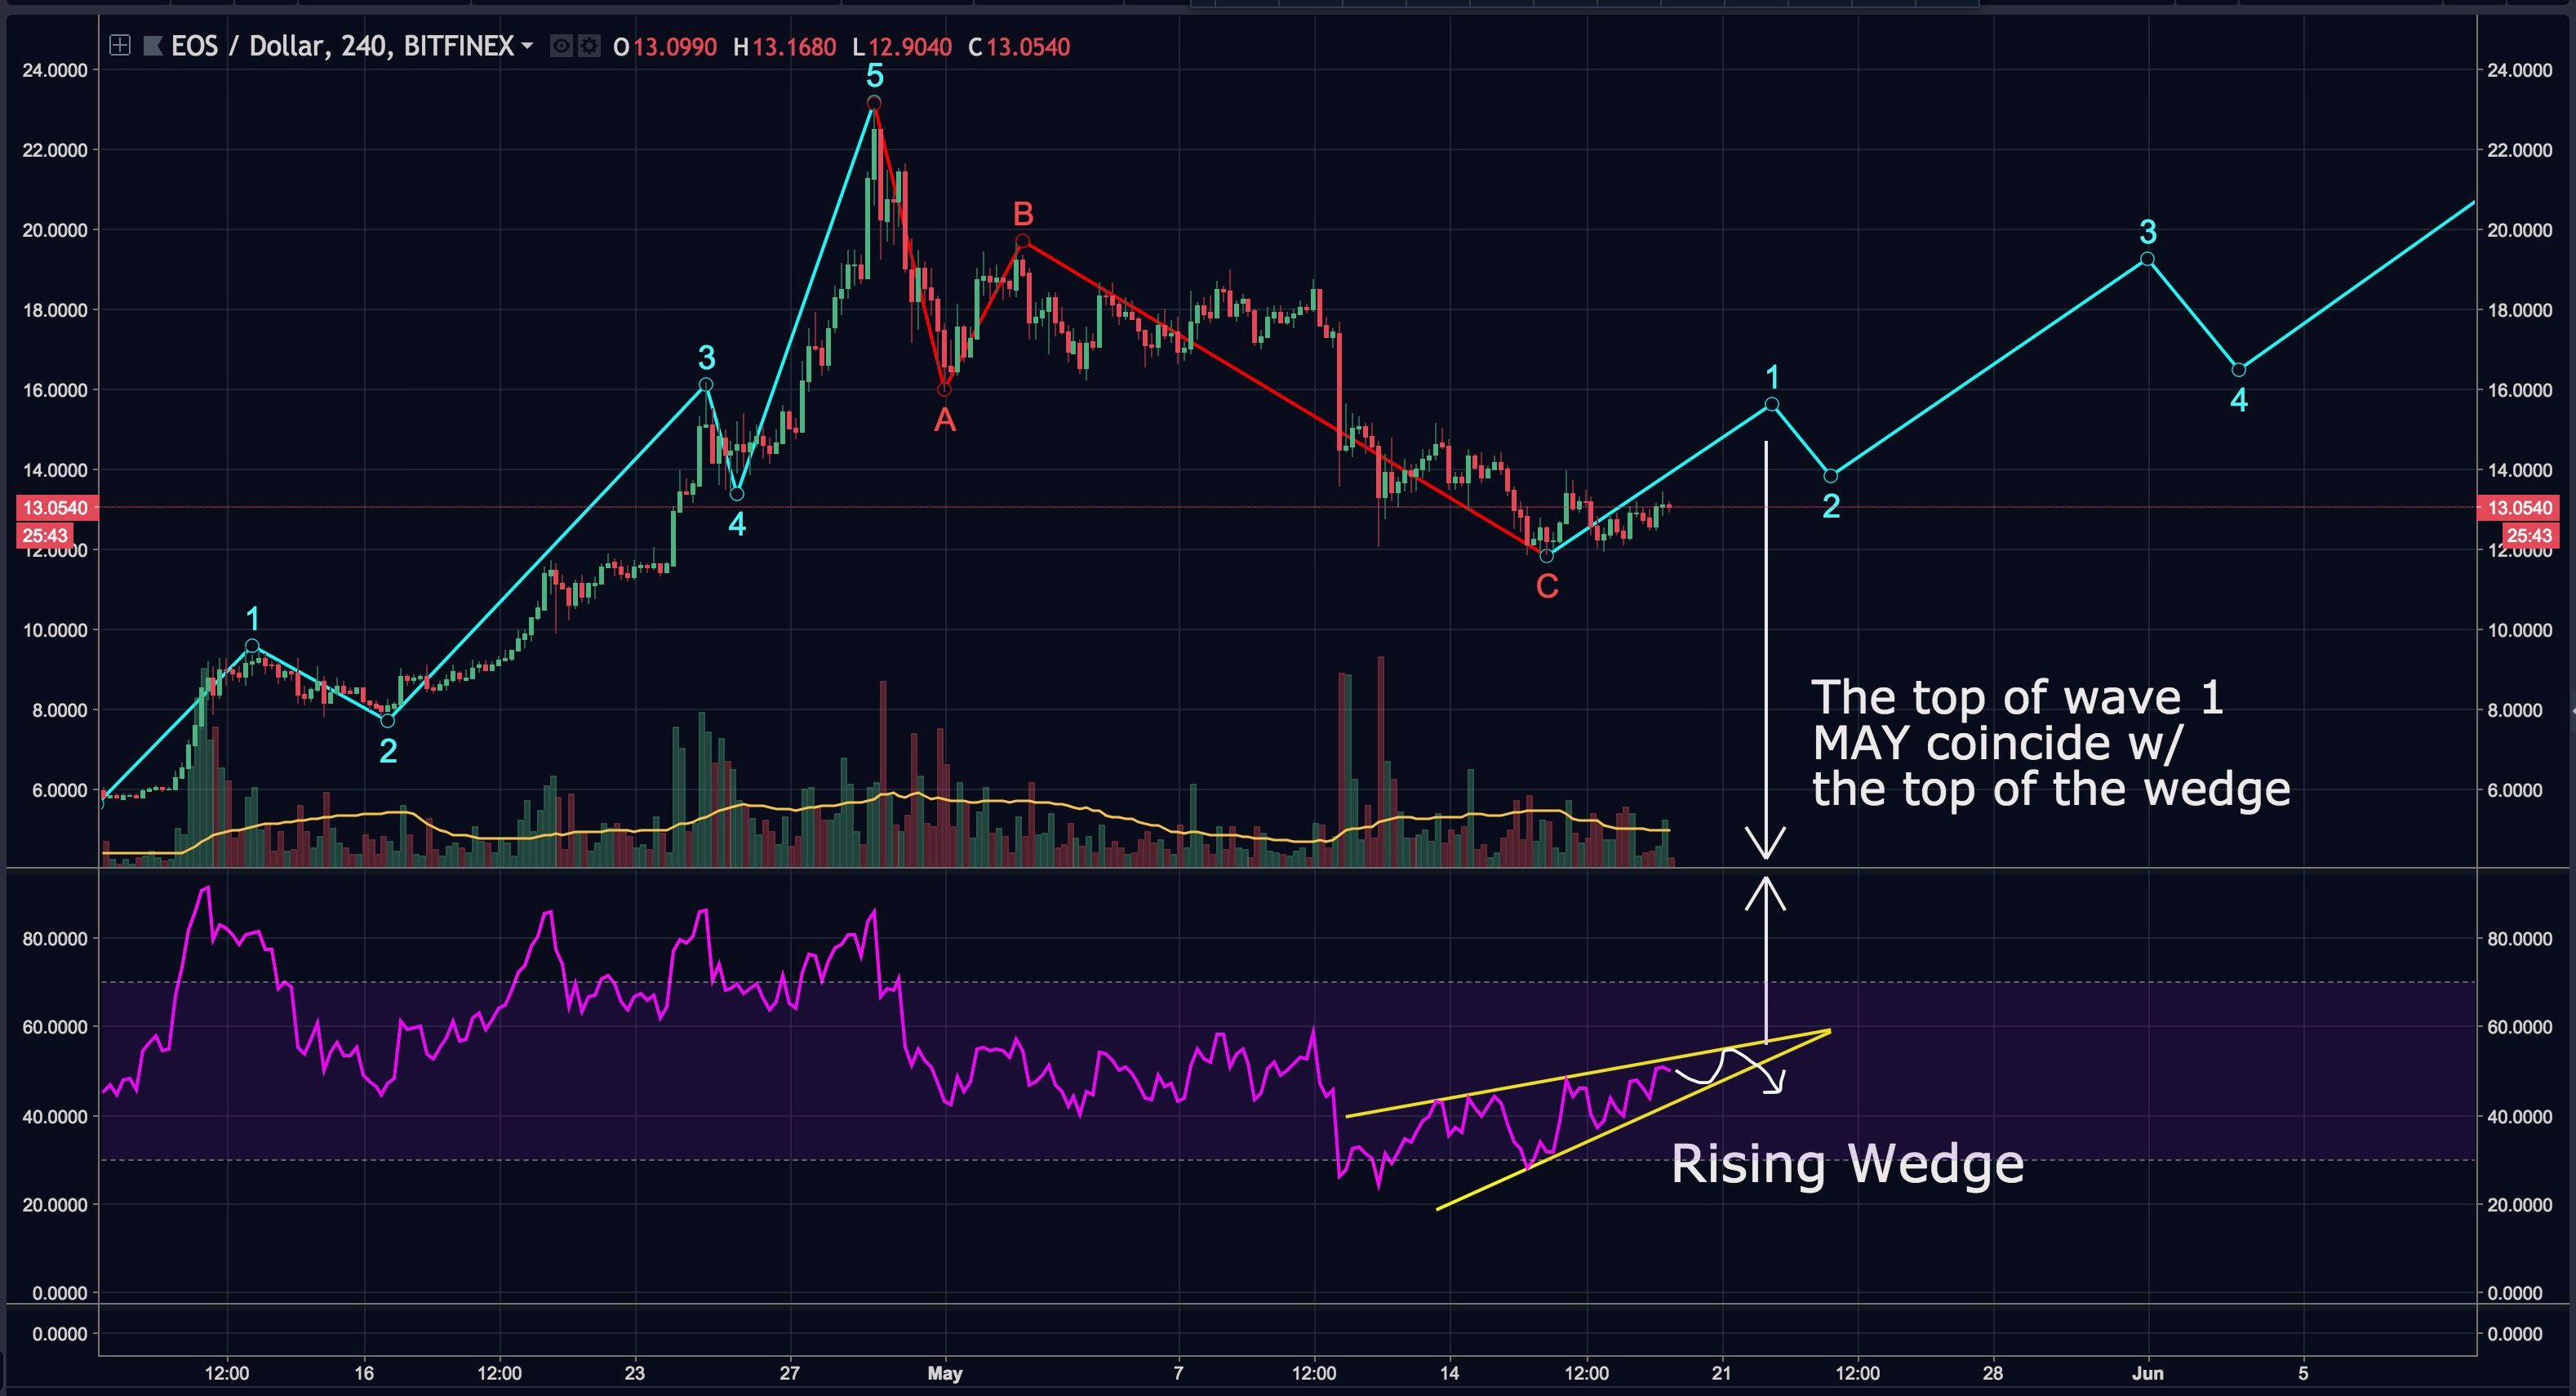
In my last EOS update I pointed out a strong support zone between $11.65 and $10.85. EOS has been consolidating on top of that support zone after what looks like the end of an ABC correction. We've seen a slight overall rise over the last couple days. This could be counted as the start of wave 1. If this is correct, that may play out like this:
Should EOS break down and out of the symmetrical triangle, we might see the support zone catch it. I'd expect consolidation from there before another attempt at an impulse wave up. This scenario may look something like this:
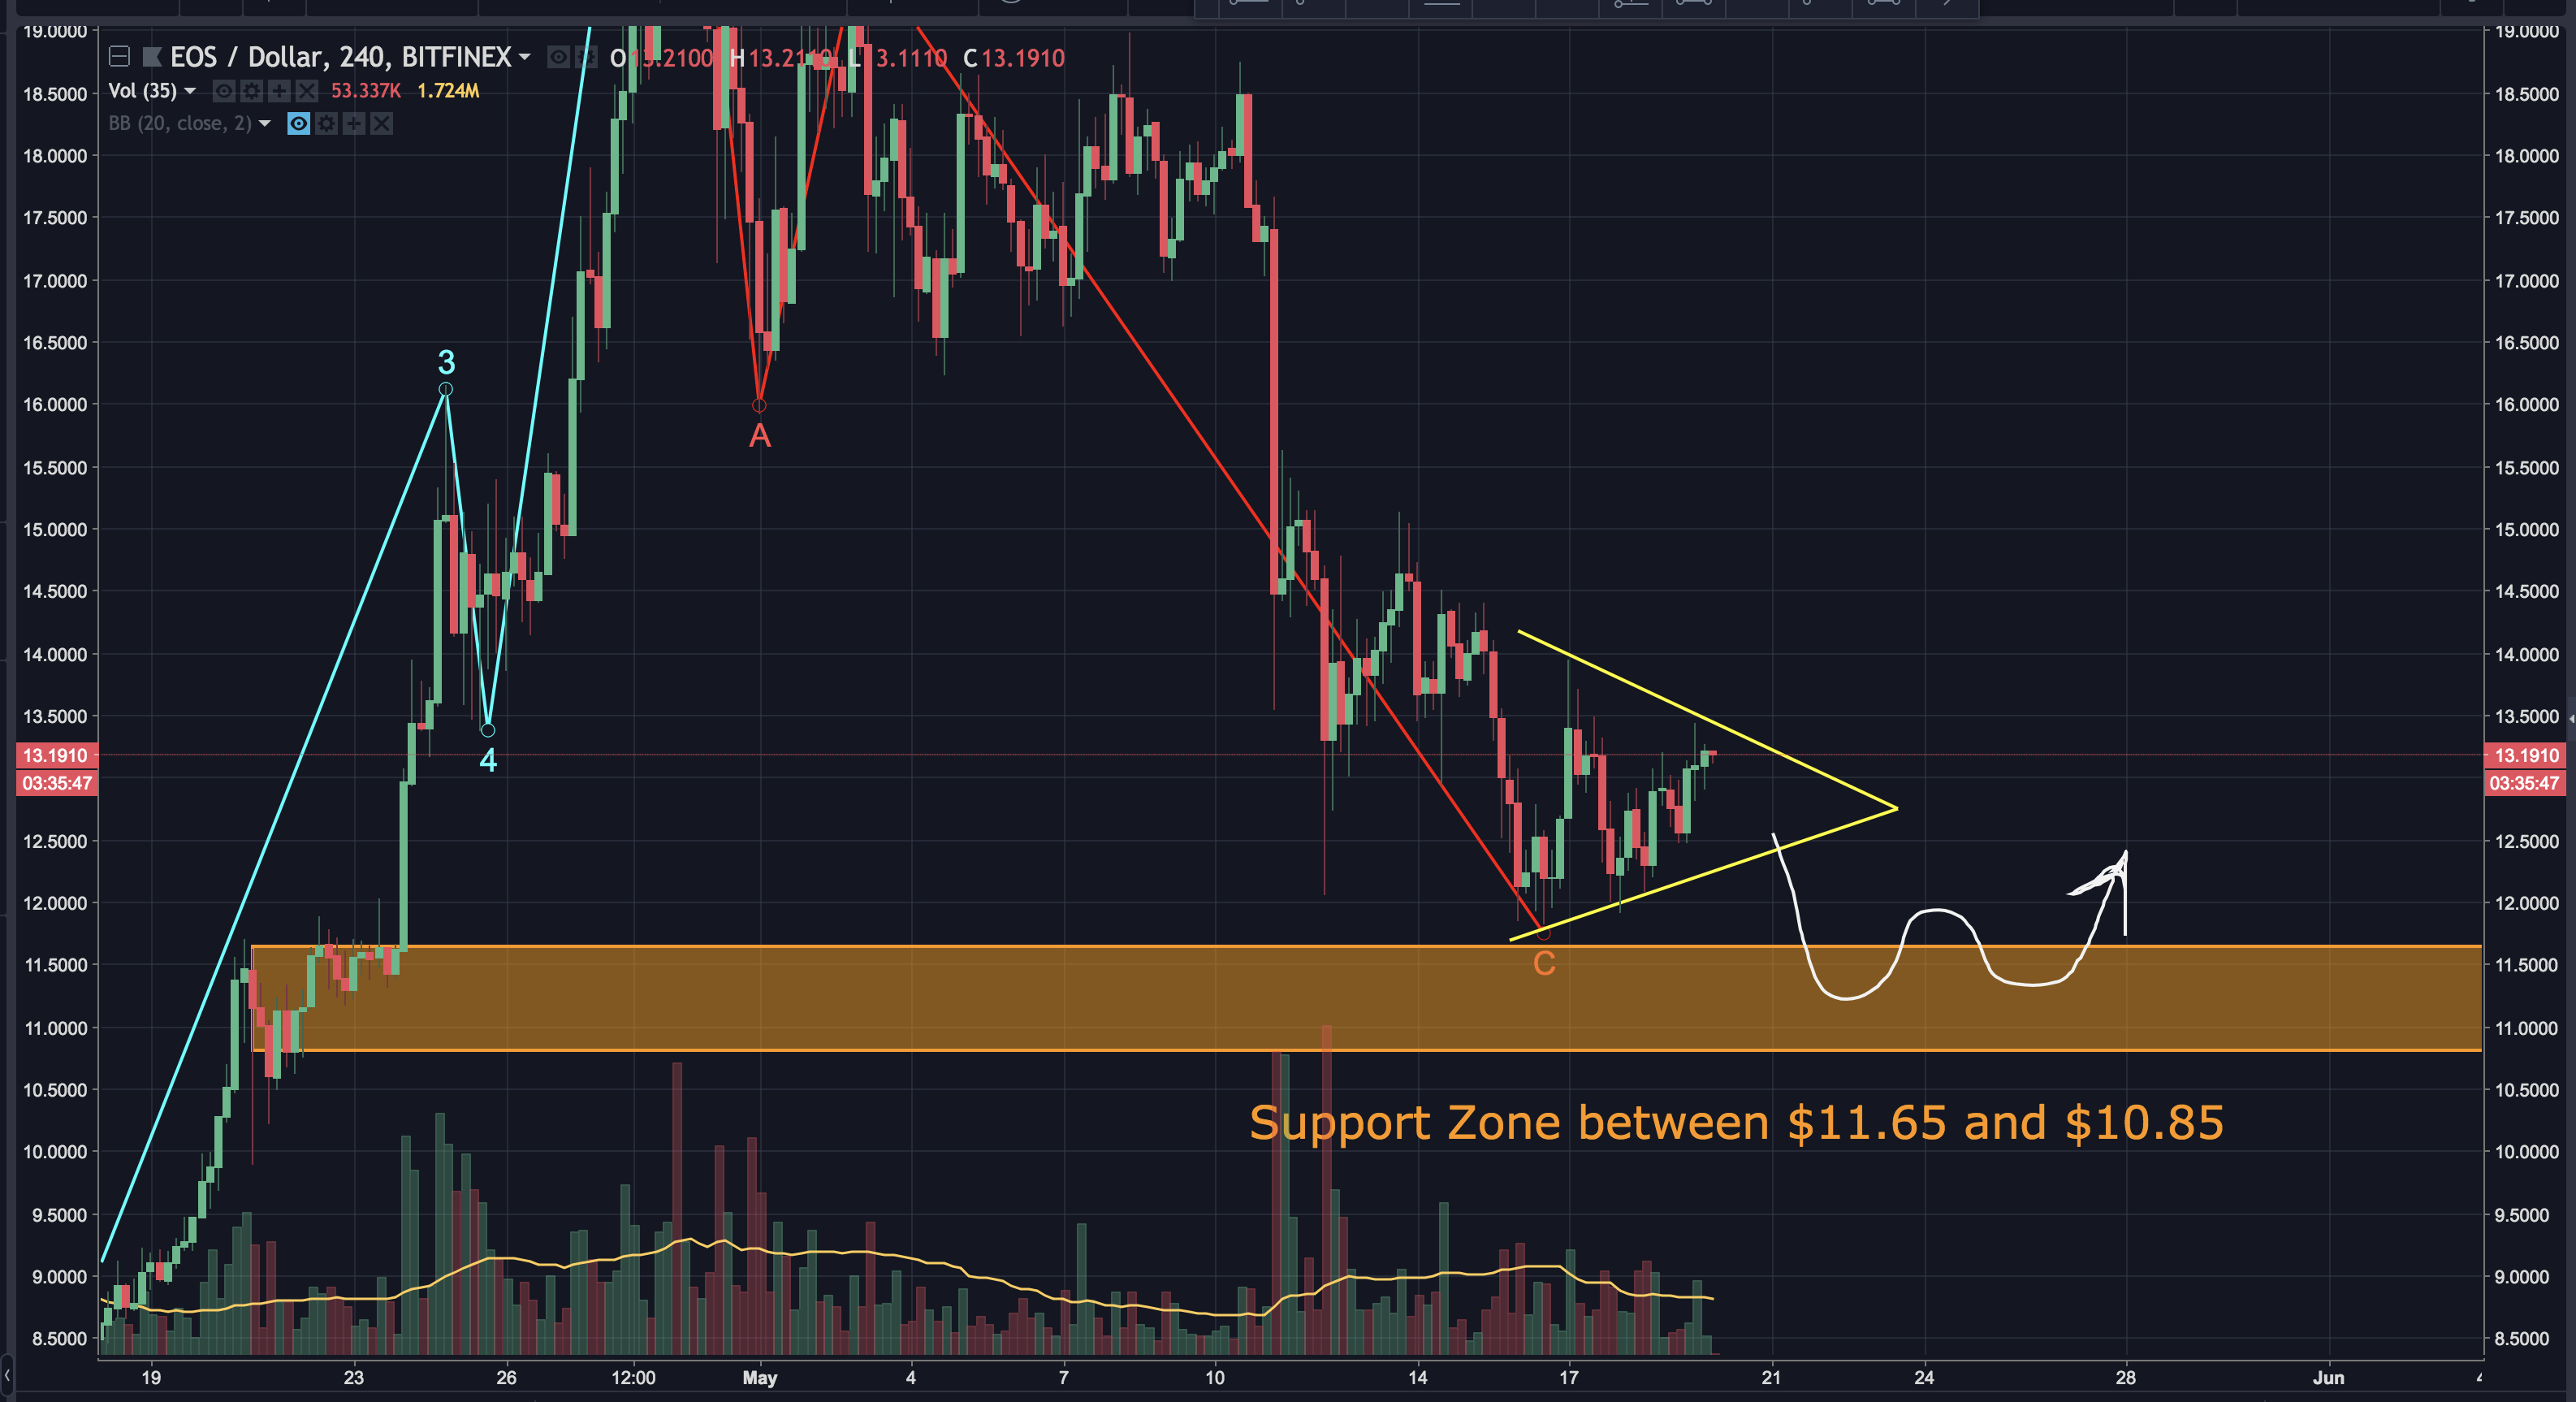
If the above support zone fails, I'll need to reassess my analysis.
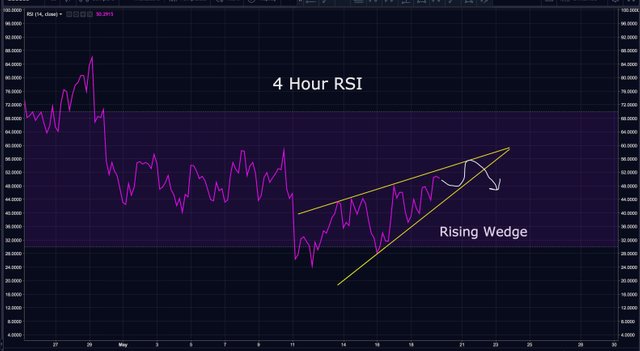
Looking at the 4 hour RSI, we can see a rising wedge. As it gets closer to the top (apex), we would expect a temporary break down.
What's interesting is when you look at the wedge on the RSI compared to the chart. We can see the expected drop around the apex of the wedge may coincide with the start of wave 2. Let's see if it actually unfolds this way.
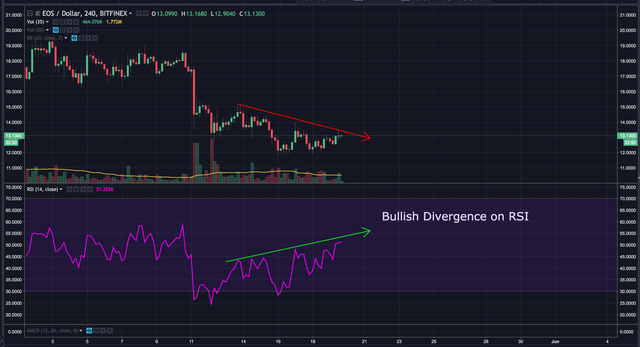
The RSI is also showing us clear bullish divergence. This signals a strengthening market.
Finally, the 21 day EMA has been acting as resistance for about a week and a half now. EOS just broke through and the 4 hour candle closed above..signaling break through confirmation. This is another sign of a strengthening market.
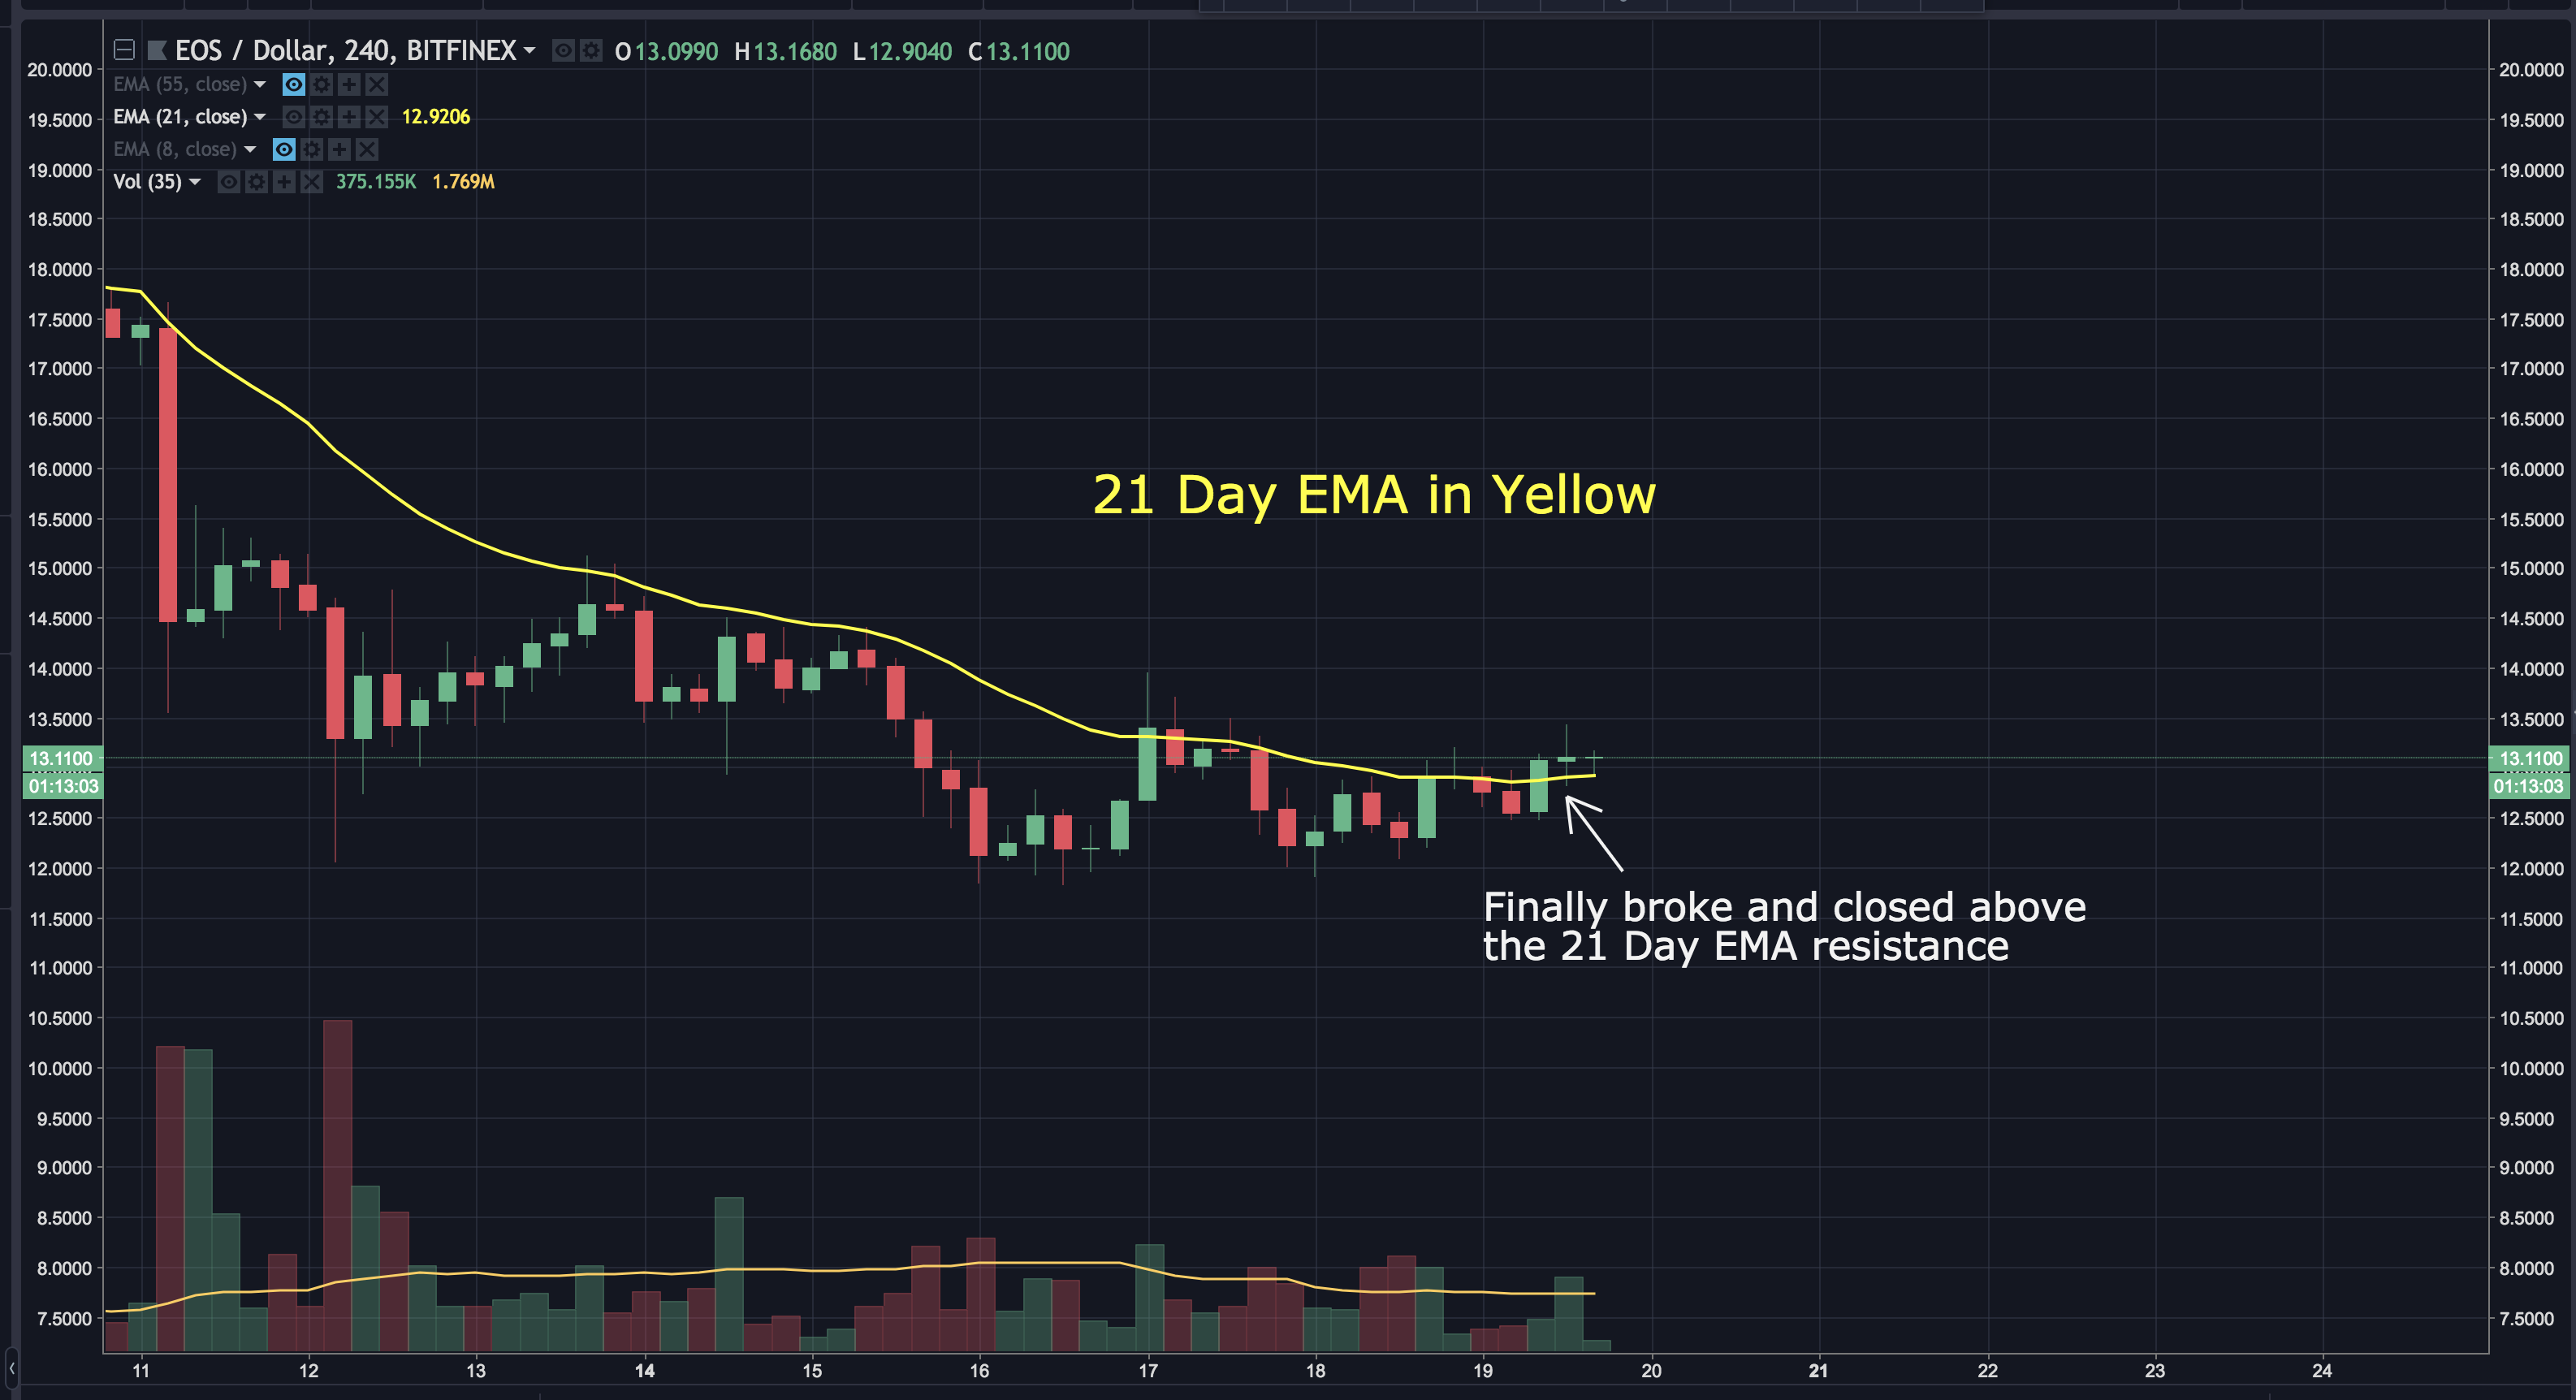
We can also see the 8 day EMA is attempting to cross above the 21 day EMA. If this happens, it would also be a very bullish sign.
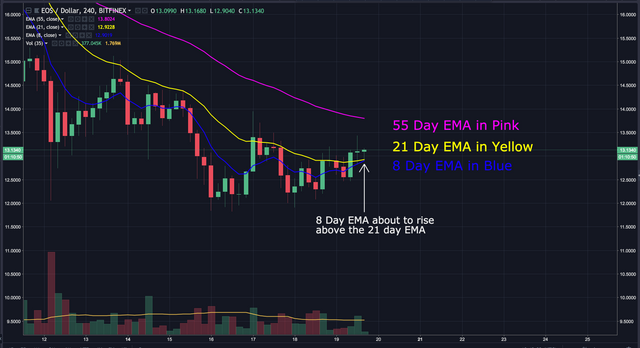
If you're unfamilar with how to use EMA's, refer to my post on the topic here: https://steemit.com/cryptocurrency/@workin2005/simple-effective-strategy-to-buying-and-selling-market-trends
BIAS:*
Short Term: Neutral
Longterm: Bullish
I hope this has been helpful. I’d be happy to answer any questions in the comment section below. Thanks for stopping by.
If you found this post informative, please:

Disclaimer: I am NOT a financial advisor and this is NOT financial advice. Please always do your own research and invest responsibly. Technical analysis is simply a guide. It doesn’t predict the future. Anyone that claims they know exactly what’s going to happen is foolish, lying or both. Technical Analysis should only be used as a tool to help make better decisions. If you enter a trade, I recommend having a stop loss and sticking to it. You will loose at times. The key is to have more wins than losses. With that in mind, I wish you great success.
If you don’t have an account on Binance, I STRONGLY recommend getting one. They’re usually the first to get reputable coins, have excellent security and second to none customer service. You can sign up here free of charge: https://www.binance.com/?ref=16878853
Good analysis, keep up the good work
Thanks @aclarkuk82
Excellent analysis. You've helped make me a good amount of money over the last month. I really appriciate your work.
thnx. I've been following EOS since start of ICO. I strongly believe it will be extremely bullish after nw becomes operational.
That would be nice.
Good work. Waiting for EOS main net launch and a breakout of this trend..
It should be interesting to watch. This is uncharted territory.