EOS drops...Where's the bottom?

Unfortunately, EOS has been following the bearish path I outlined 2 days ago. Let's see if we can find the bottom of this downtrend.
Zooming out to the daily chart, we can see 5 prior waves up, followed by an ABC correction that we're currently in. Using the fibonacci retracement tool, we can see wave C was hovering on the 0.5 fib level for a few days before breaking down below it. The next logical support would be the 0.618 fib level.
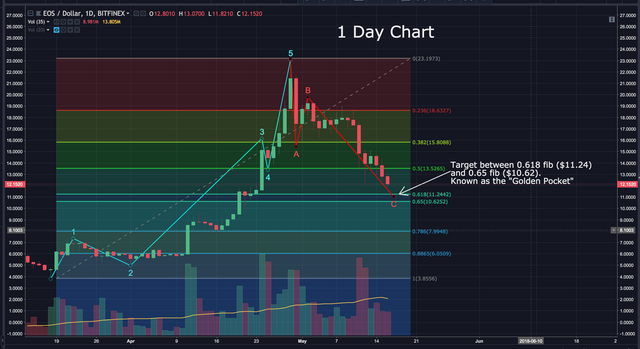
For those unfamiliar, 0.618 is known as the "golden ratio". This ratio is found in everything from nature, to the orbit of planets and even our very DNA. In finance, this ratio is often the fib level that provides the most support. This is where assets tend to bounce off regularly. We all know at times a candle's wick can slightly penetrate even the strongest levels of support. For this reason, the area between the 0.168 and 0.65 fib level is known as the "Golden Pocket". This zone is a logical area to expect EOS to bounce before beginning another impulse wave up.
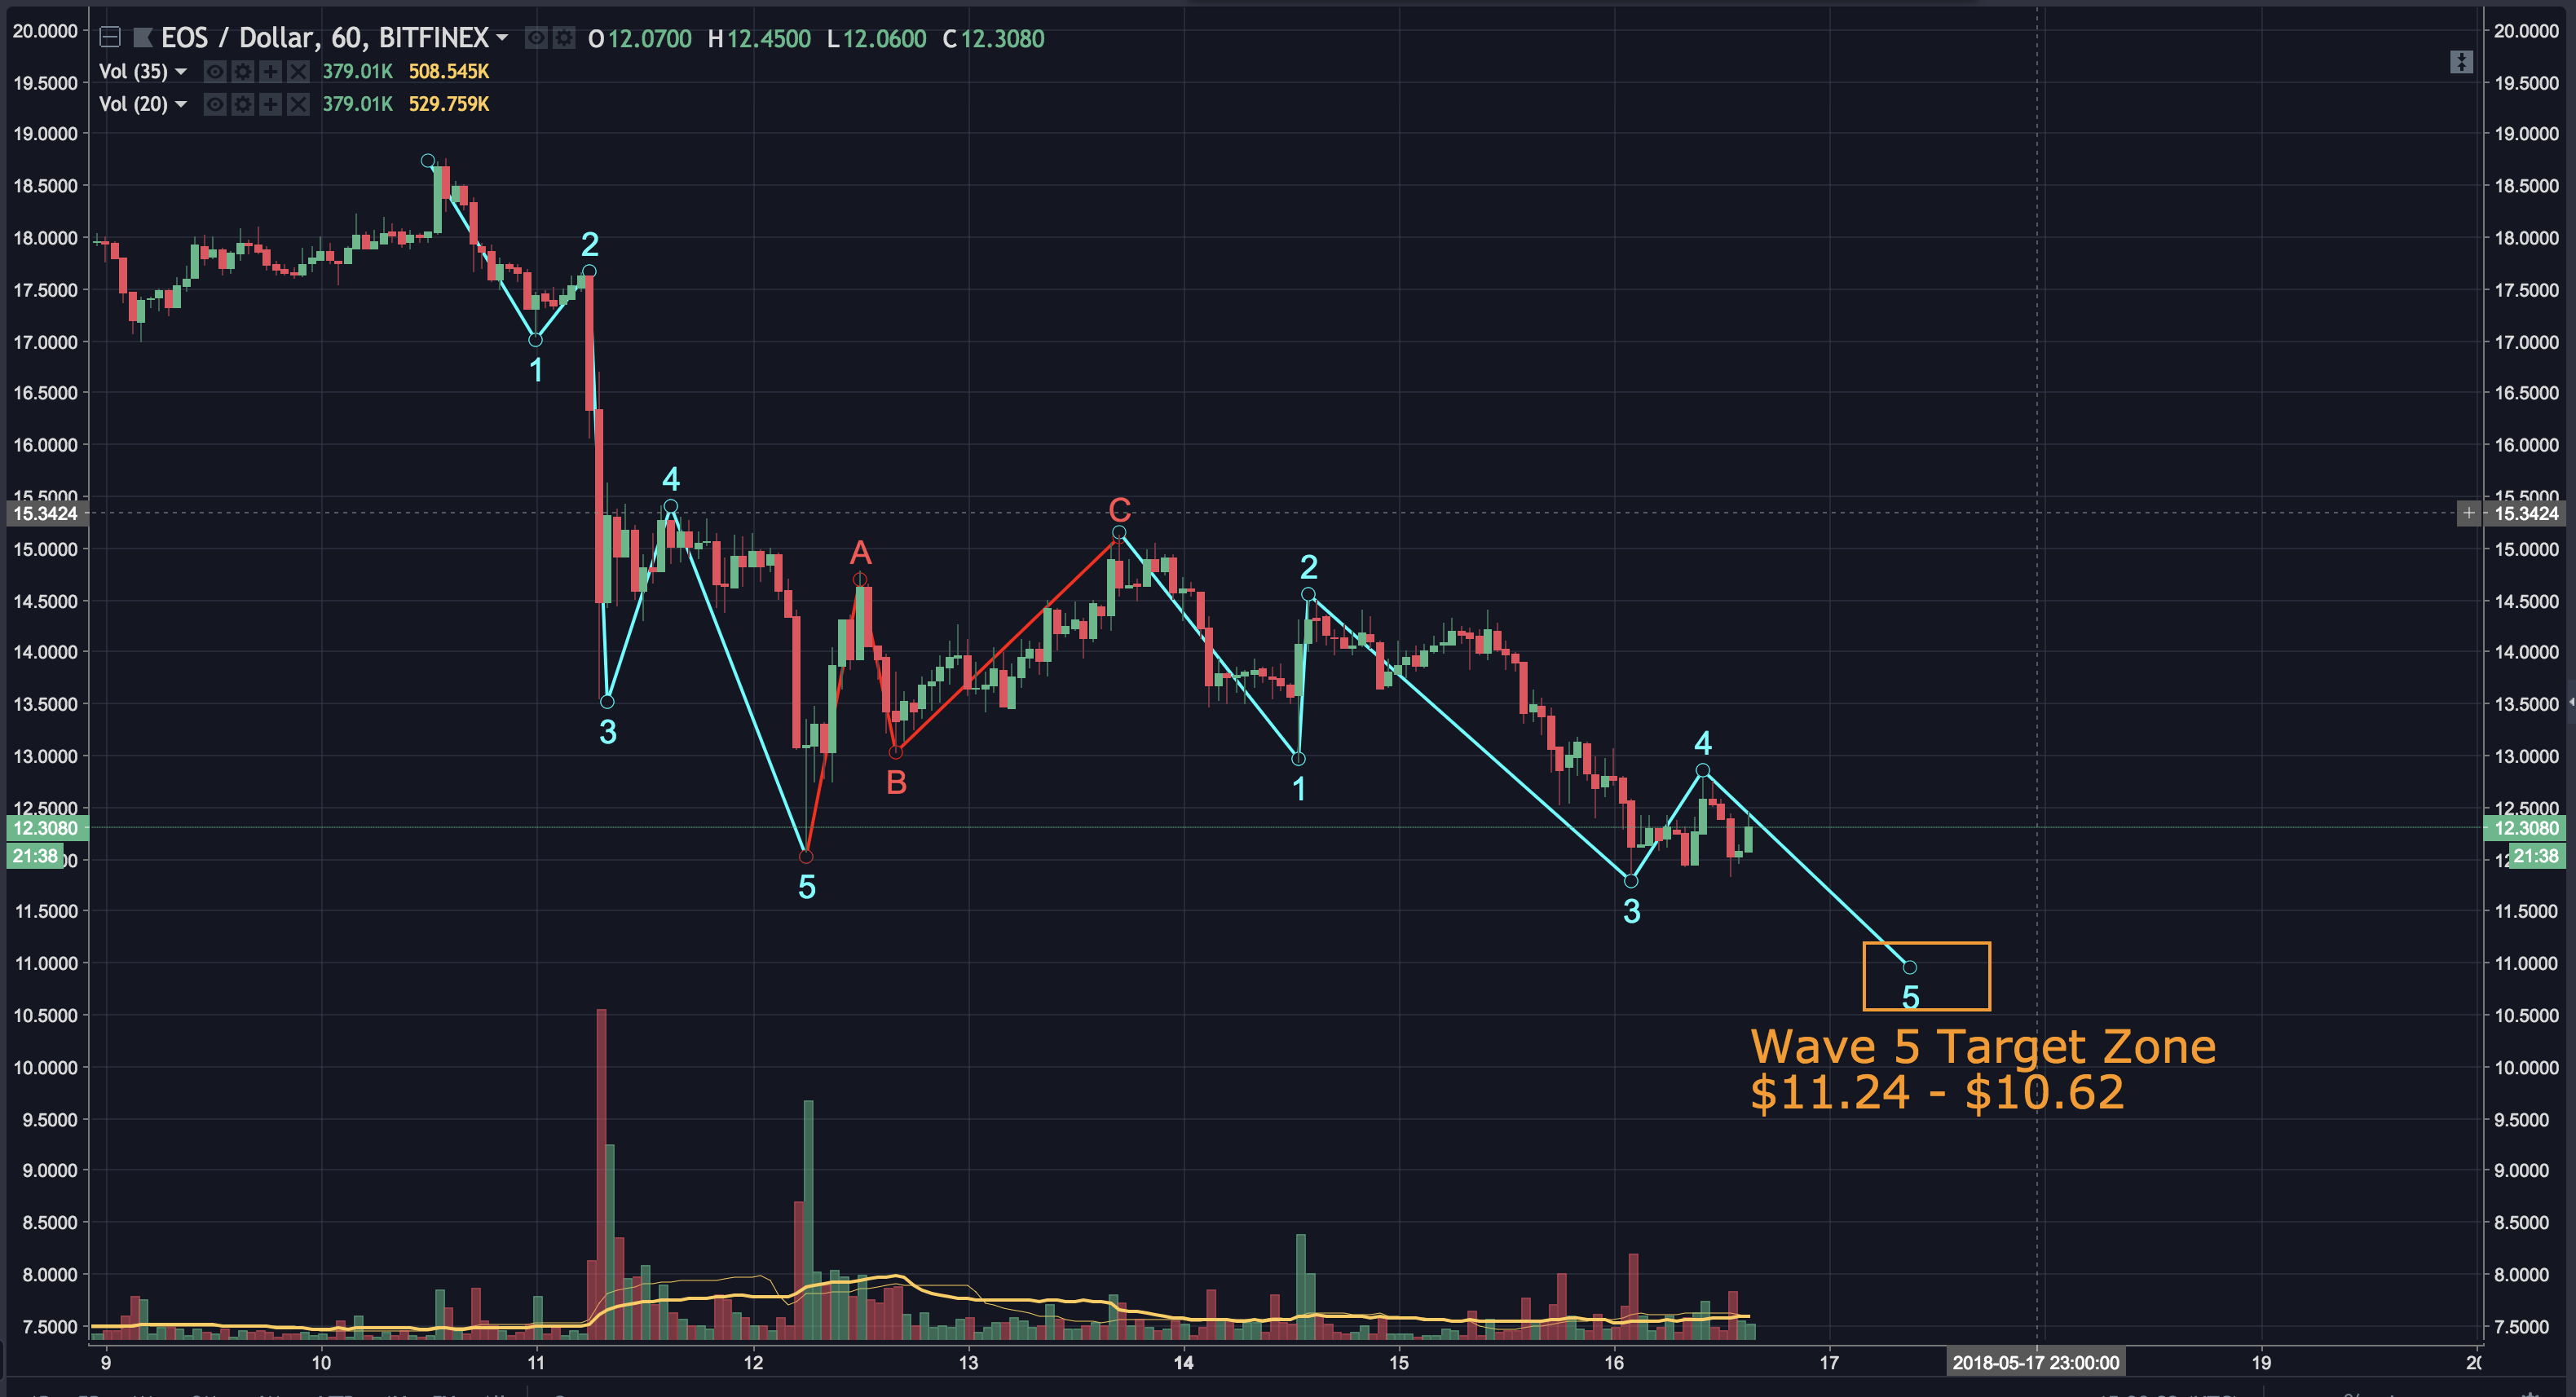
Zooming in closer to the 1 hour chart, we can see the continuation of the bearish count I pointed out 2 days ago. Wave 4 may or may not be complete. Based on the analysis I just gave on the daily chart, a logical target for wave 5 is between $11.24 and $10.62.
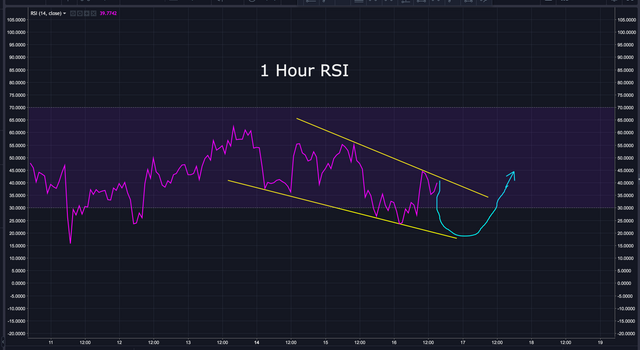
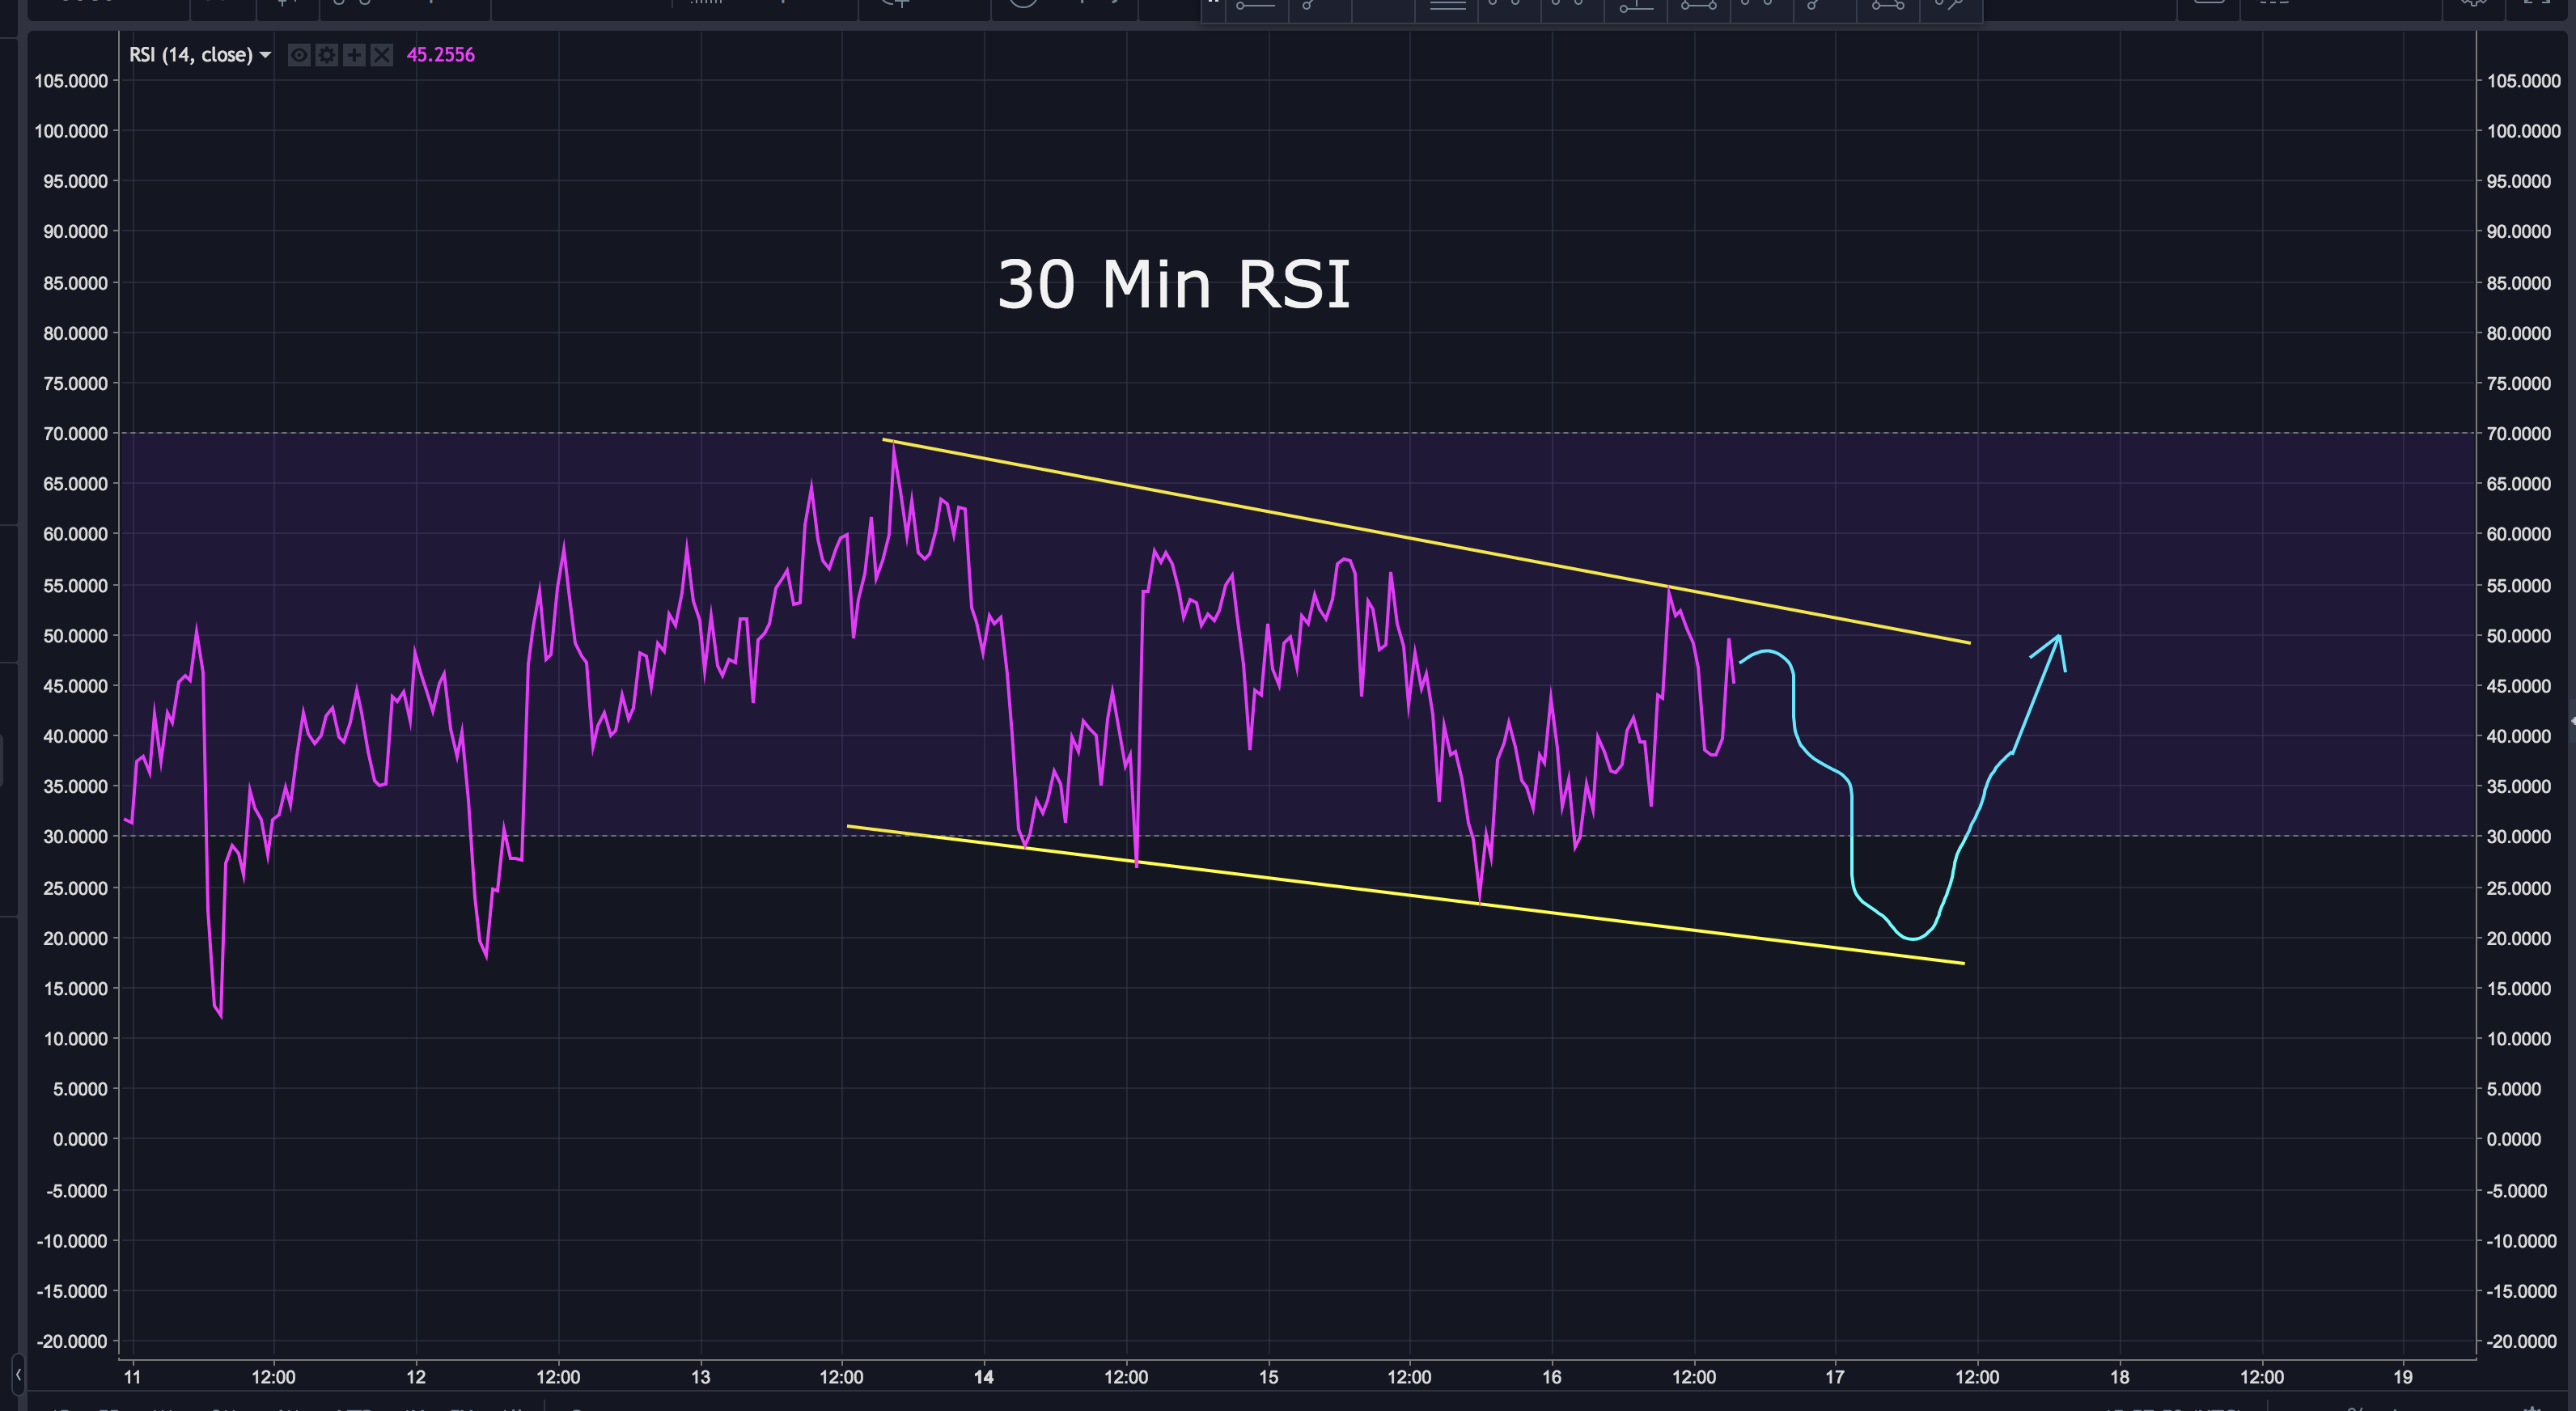
Looking at the 1 hour and 30 min RSI, we can see they both have developed a descending support and resistance line. I've drawn out what MAY play out as wave 5 completes.
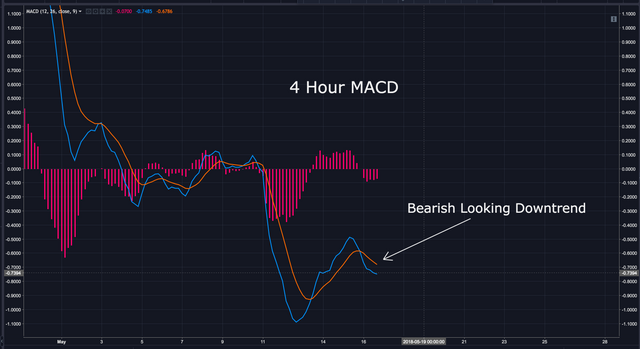
Looking at the 4 hour MACD, we can see it's developed a bearish looking downtrend.
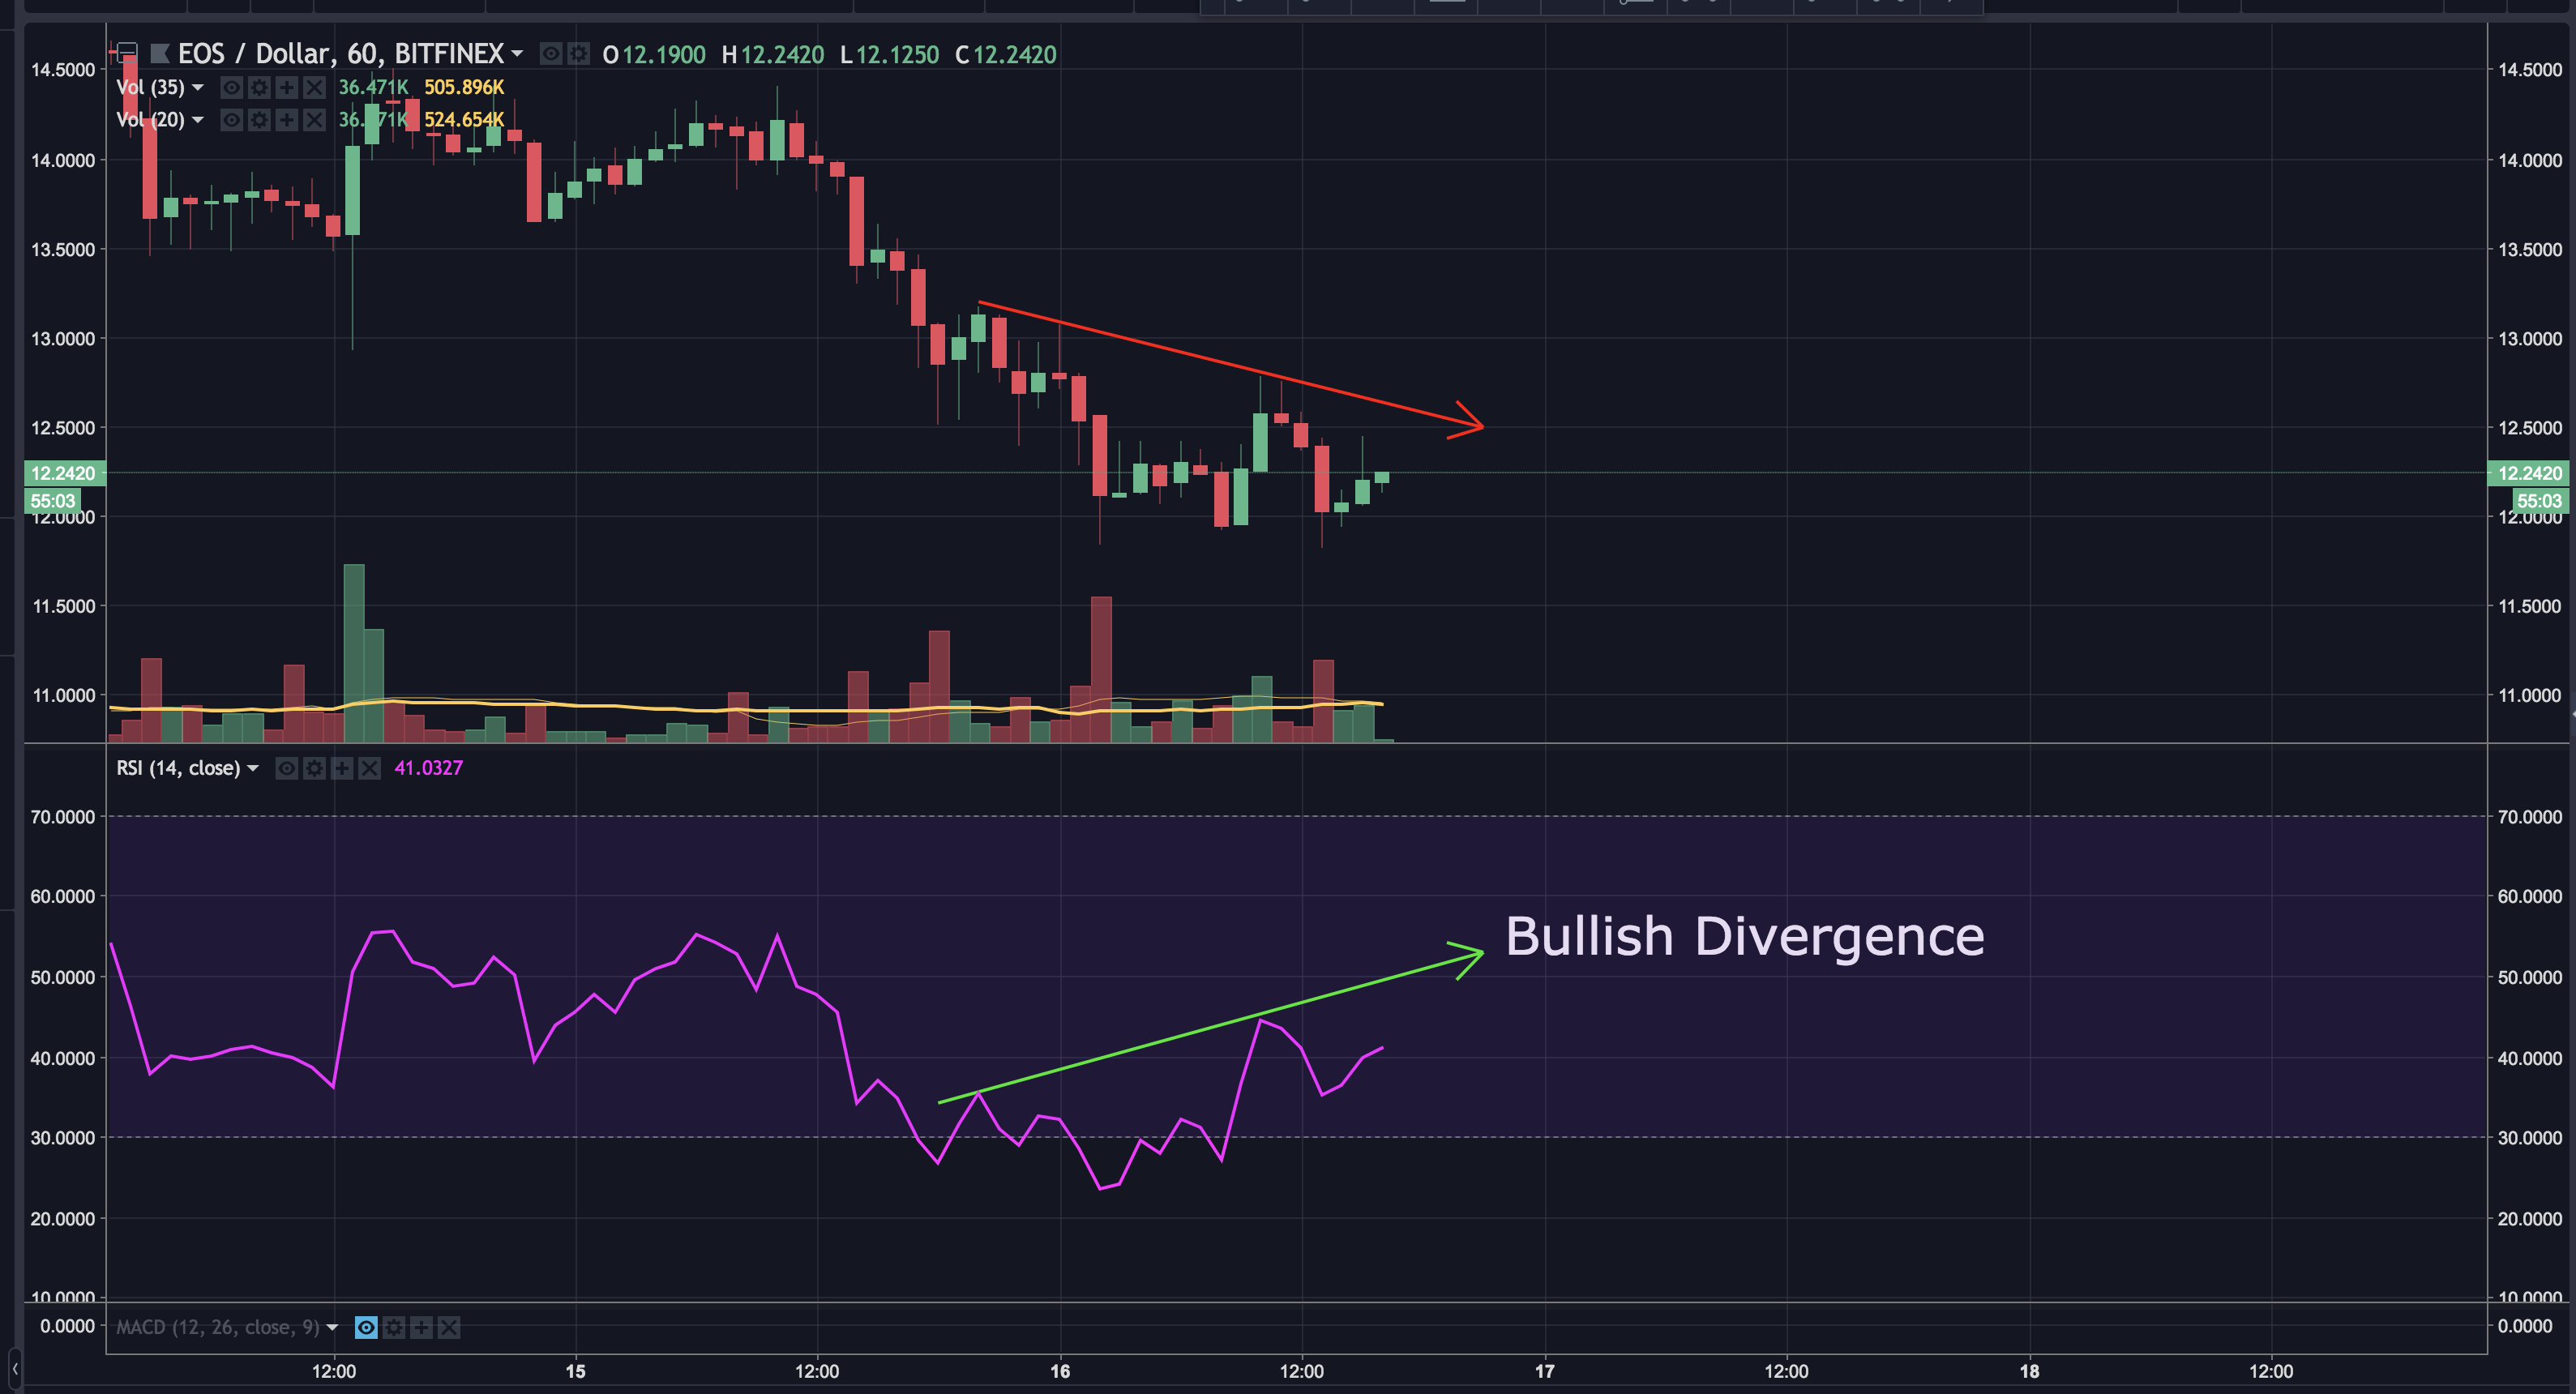
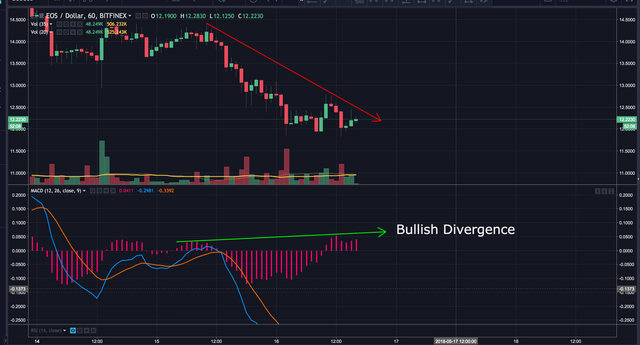
There are some positive signs that may suggest this down trend is slowly coming to an end. If we compare the 1 hour RSI and MACD to the price chart, we can see clear bullish divergence. In other words, the RSI and MACD rose higher, as the price dropped lower. This is often a prelude to a trend change.
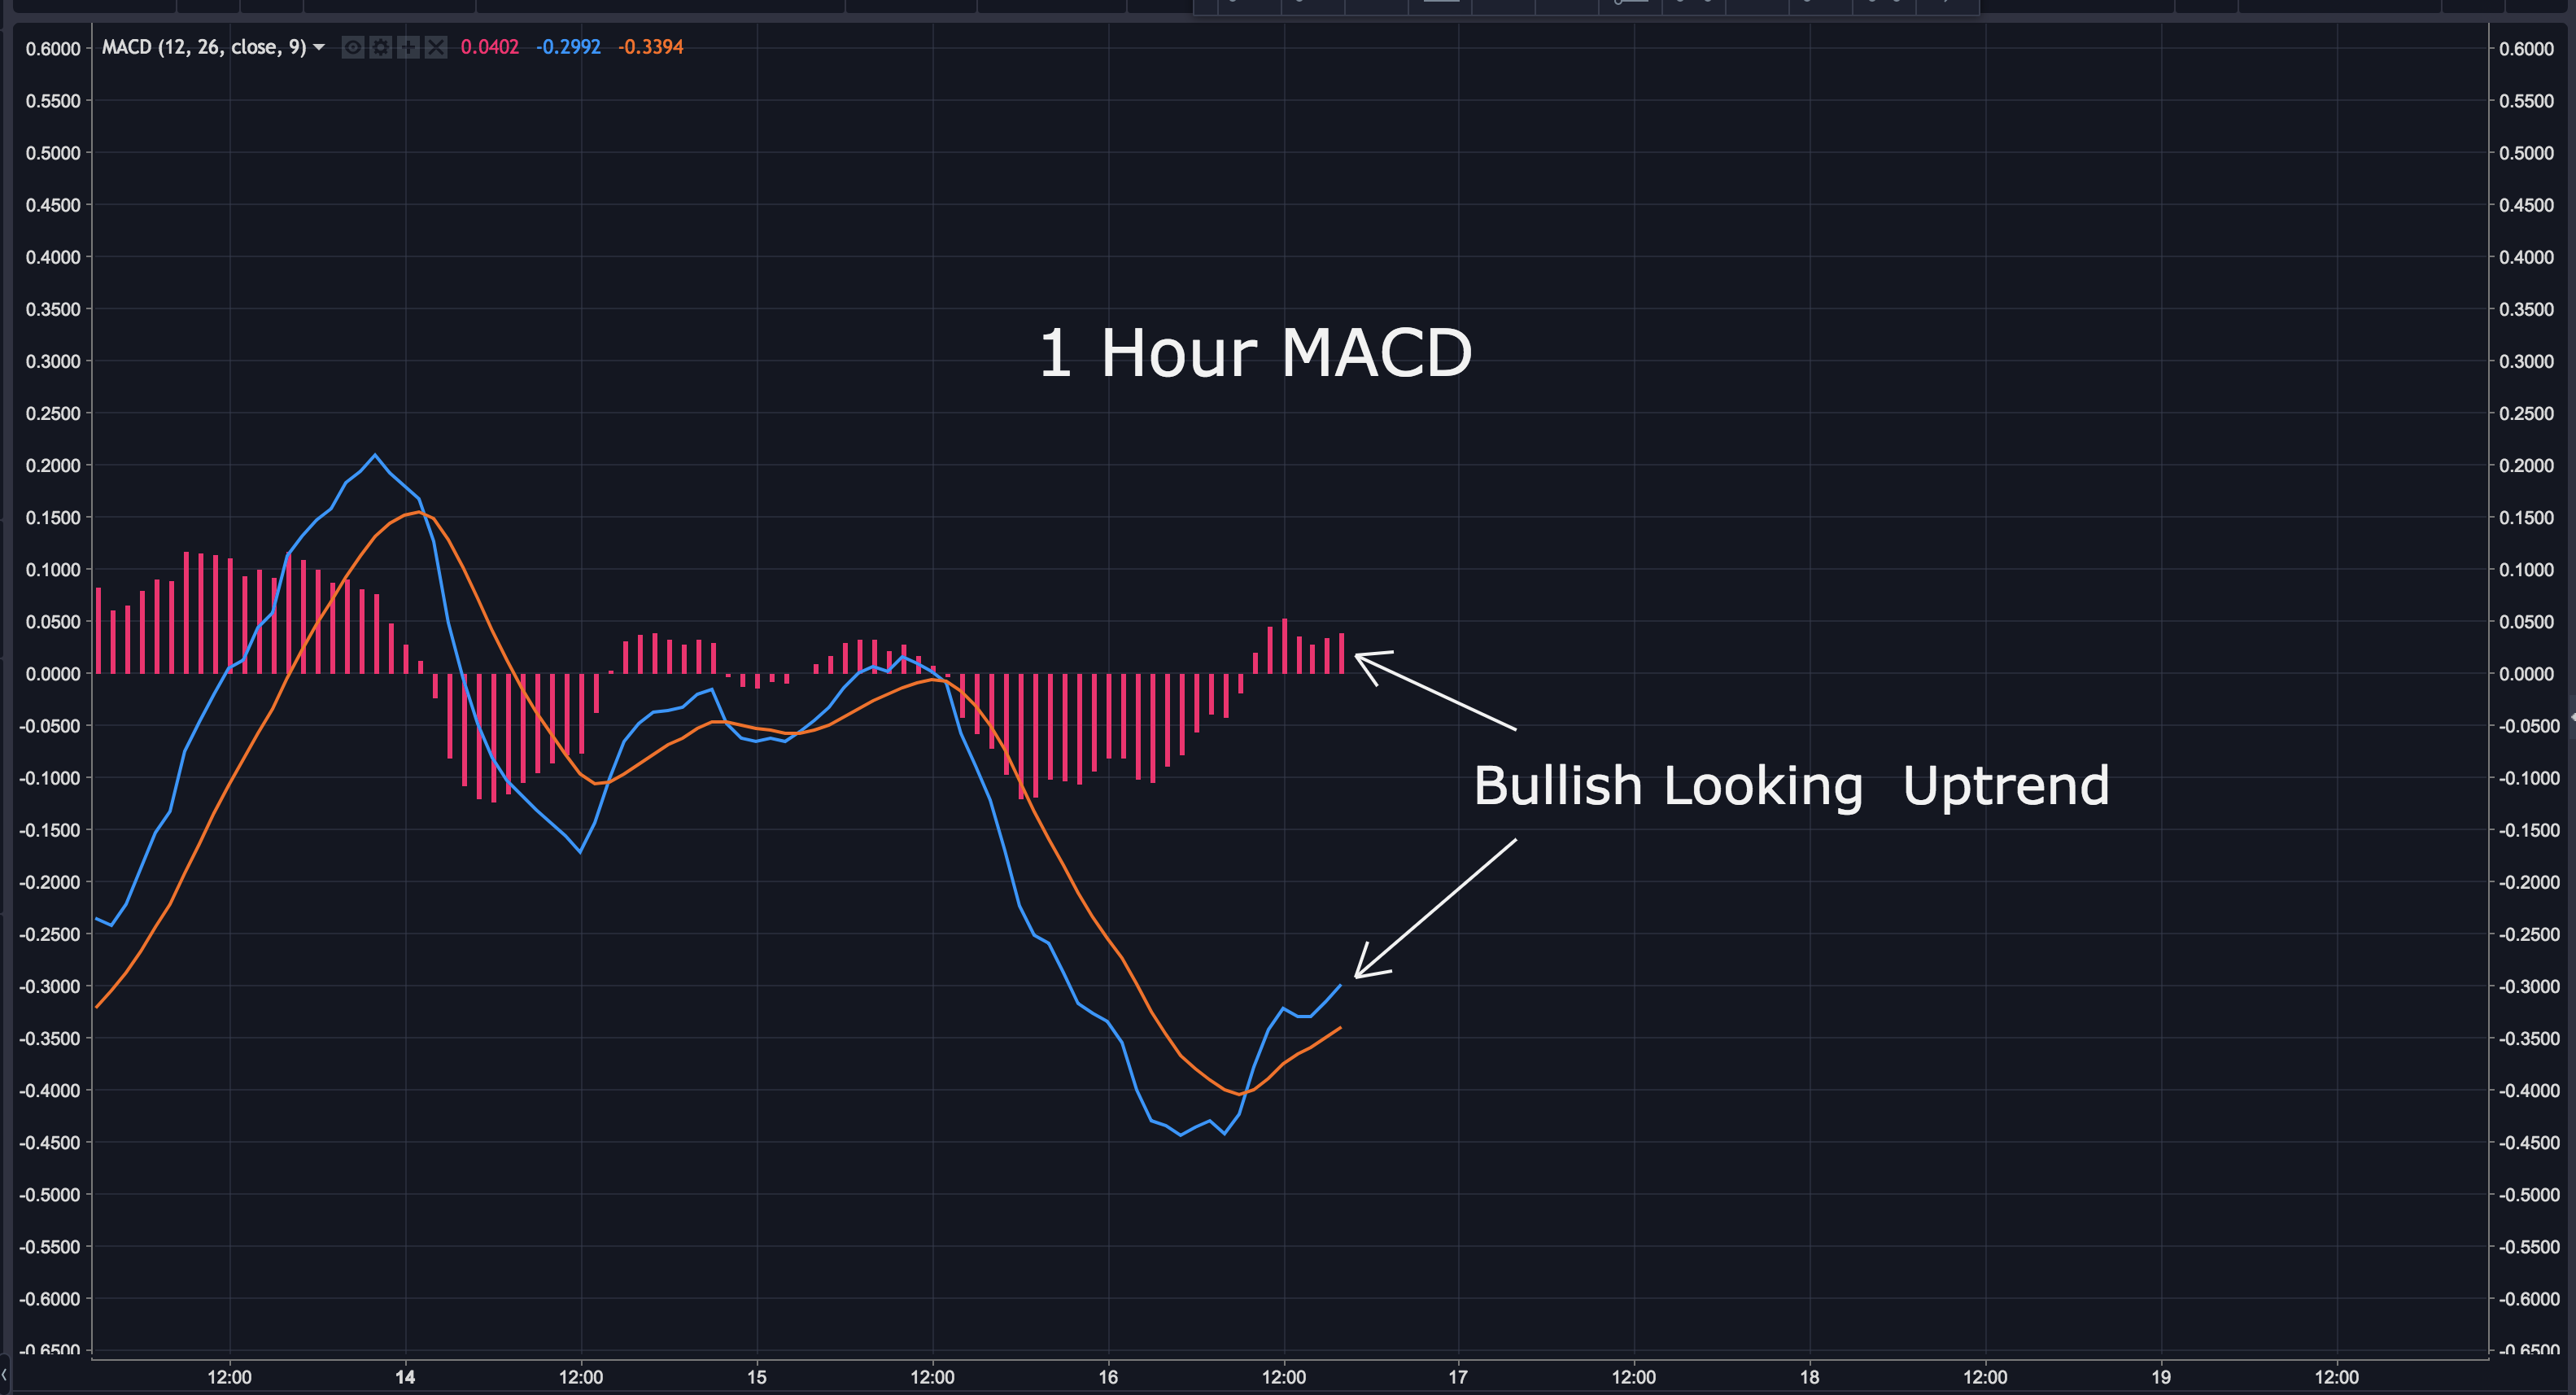
Looking closer at the 1 hour MACD, it's actually starting to diverge from the 4 hour MACD and show an uptrend. Let's see if it lasts.
These positive signs suggest it's possible we could see a truncated 5th wave, or a complete wave 5 failure. Let's keep an eye on those resistance lines I pointed out on the RSI. If the resistance is broken, we may see a trend reversal. If that happens, I'll need to re-evaluate my analysis.
As I always say, I can't tell you whether or not to buy or sell. I'm NOT a financial advisor. All I can do is tell you what I'm doing. For me, this is a no trade zone. I'll be looking to latter into a position around $11.00, or once I've confirmed a trend reversal. Until then, I'm sitting on the sidelines with my trading. That said, I do have a fair amount of EOS as a long term hold that I will not sell for at least a year...regardless of that the price does.
BIAS:
Short Term: Neutral
Longterm: Bullish
I hope this has been helpful. I’d be happy to answer any questions in the comment section below. Thanks for stopping by.
If you found this post informative, please:

Disclaimer: I am NOT a financial advisor and this is NOT financial advice. Please always do your own research and invest responsibly.
If you don’t have an account on Binance, I STRONGLY recommend getting one. They’re usually the first to get reputable coins, have excellent security and second to none customer service. You can sign up here for free: https://www.binance.com/?ref=16878853
When the global crypto market moves up, EOS will move up too.
Absolutely, all other coins/tokens will bitcoin as they are all priced at the value of x satoshis. A rising tide lifts all boats as they say (and vice versa).
Agreed...but I also think EOS has a good chance of breaking away from the rest of the market. If the main-net launch goes well and some of the companies building on their platform are successful, it may rise regardless of bitcoin and the overall crypto market. This is uncharted territory ahead...should be interesting to see how it plays out.
Exactly
Nice chart but USD means nothing. If BTC will go up price with $ will go up. I would like to see BTC chart because I invested BTC instead of USD. (I think no one bought EOS with USD).
Very clear and complete analysis, thanks for including the detail of supporting MACD and RSI divergence, and the explanations of the golden pocket. My position is all in, fully subscribed on EOS. A wave 5 failure is where the price abandons EW theory and goes up instead? How is that different from a truncated 5th wave or are they the same? So, EW theory and price behavior doesn't always play out? Upvoted and resteemed, thank you, excellent post!
Thanks my friend. A truncated 5th is just a shortened 5th wave. That's different from a complete failure. If wave 5 fails to go past the end point of wave 3, it's considered a failure.
Of course lot of the movement depends on the overall market, but i wonder if this is not already the pre-launch dip, that most expected...
I think it's a combination of the prelaunch dip and the overall market.
@therealwolf 's created platform smartsteem scammed my post this morning (mothersday) that was supposed to be for an Abused Childrens Charity. Dude literally stole from abused children that don't have mothers ... on mothersday.
https://steemit.com/steemit/@prometheusrisen/beware-of-smartsteem-scam