RSI: Relative Strength Index or Real Stickler In (the Ass)
Pre-requisites: None
Introduction
I love using RSI. Why? It’s one of the first indicators I learned how to use and it is really easy to get the hang of.
RSI is a measure of how strong a market performs based off of previous price action. In summary, the higher the RSI value the more bullish a market is. The lower the value, the more bearish a market is. But markets tend to equilibrate past a certain point, thus, past an RSI of about 80, one can expect a slight pull back in price. Consequently, an RSI lower than 20 can cause one to speculate that the price might bounce back up as a result of the continued bearish slump. Easy to use right?
Kind of.
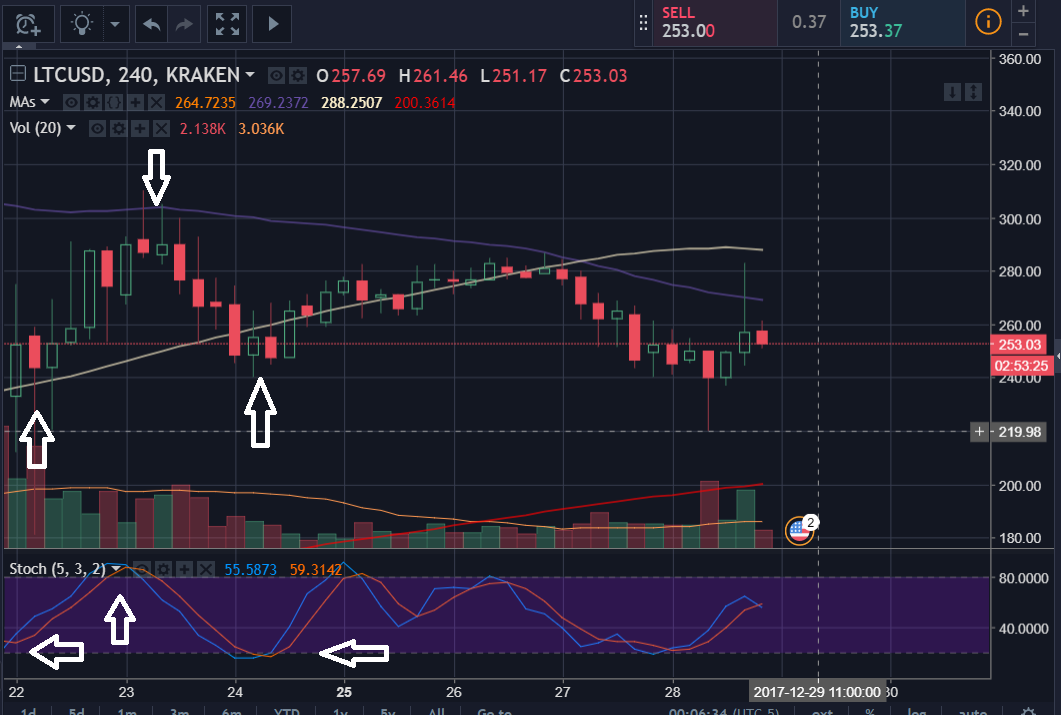
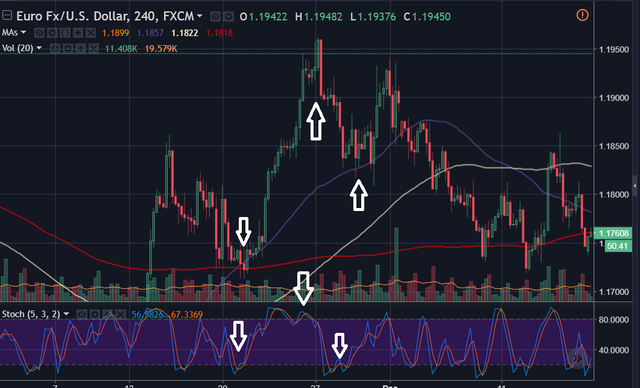
Let’s look at a few examples of how the latter statements hold.
Problems
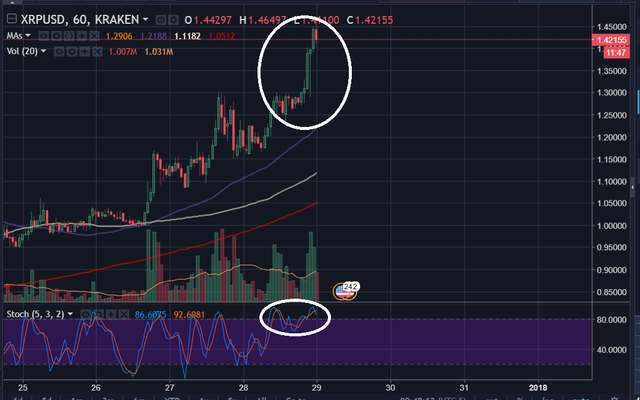
Now let’s find some problems. On an intuitive level, one might associate the magnitude of the change in RSI to the magnitude by which the price changes as I did before. Unfortunately, this works less frequently than expected. From a logical perspective, it makes sense that this doesn't work. If this statement were to hold true, markets would not grow, nor would they shrink, they would stay in a perpetual state of overall stagnation – a state in which we rarely see. Here are two examples from XRP/USD:
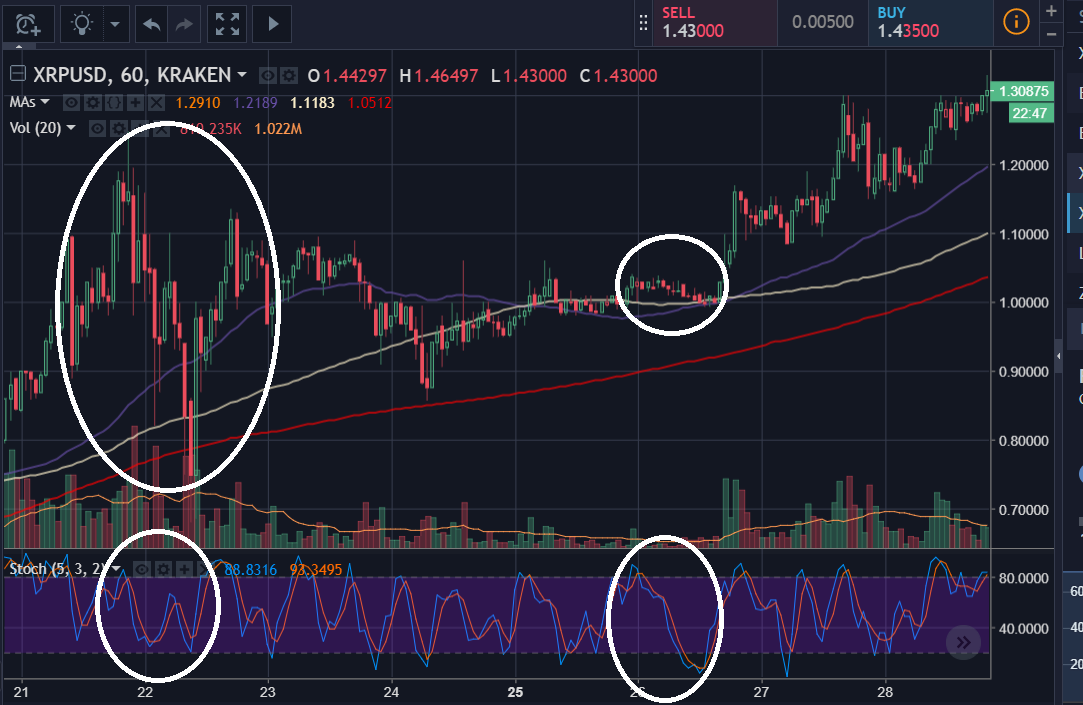
Weird how the RSI experienced a lower drop from the first set on the left, however, it correlated to a much larger percentage drop in price. From this, we have to keep in mind that RSI really should only be used as an indicator of directionality, not magnitude of how things might move in the future. Further,from this, we should also learn to never underestimate how steep the price might drop/raise despite the RSI being close to 20/80.
That’s right, I said MIGHT, and the reason for that is that trading is all about probabilities not concrete predictions. The RSI never lies about direction… but only in the moment. If one were to take a look at the price action and the correlated RSI at any given moment, very rarely, if at all, do you see any discrepancy in movement of the two. The problem lies when you’re trying to predict the future. We see that in the cases shown below, there are many occurrences in which expect the price of something to drop/raise do the complete opposite.
Thus, RSI is an important trading tool, replaceable by a lot of other indicators, but still a tool that can help you extract valuable information, so long as you are weary of its weaknesses and use other indicators to help you reach a conclusion. Good luck and happy trading!
The trick is to combine more indicators together and use one for momentum or rate of change of price (AO and/or MACD), another for spot overbought and oversold states of market (Stochastic RSI or RSI) and third for determining trend directions (Ichimoku cloud)
I use mentioned combination of indicators and I can make very accurate predictions.
Check this examples: btc20, btc21 here discuss RSI also, btc22, bts5.
Hope to find another guy for TAF(Technical Analysis Forces)
Welcome aboard!!
Thank you! I'm still a beginner trader myself. By no means would I even consider myself an average one however, I do plan on sharing what I learn through the process that I feel other people on the internet don't cover too well.
Ill be sure to check those guys out, however with respect to the MACD and RSI (stochastic or regular) I find the same problems exist for each one as well as they provide repetitive information, hence why I only use stochastic in combination with moving averages and basic resistance/support strategy.
Every trader find his lethal combination if TA tools. my favorite link is https://www.investopedia.com/
Check it out!