The volatility is back!
BTC
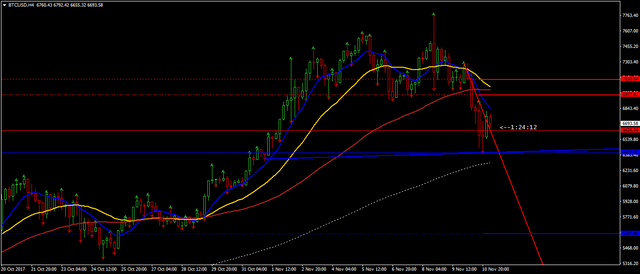
As expected, the rising vedge broke down, but $227 short of $8K despite 2 clear efforts to reach it. Currently, the price sits below all major downsloping WMAs and above still very bullish 40 days trend confirmation WMA (white dotted). The 4H chart gives a potential range for the next 48 hours with 34 and 89 WMAs confluence zone as its most likely resistance and 40 days WMA as its support.
3 consecutive 4H bars closing below $6410 opens up a lower target of $5607. However, technically the most likely outcome of the BTC price action over the next 48 hours is oscillation within the above range.
https://www.mql5.com/en/charts/7883118/btcusd-h4-simplefx-ltd
ETC
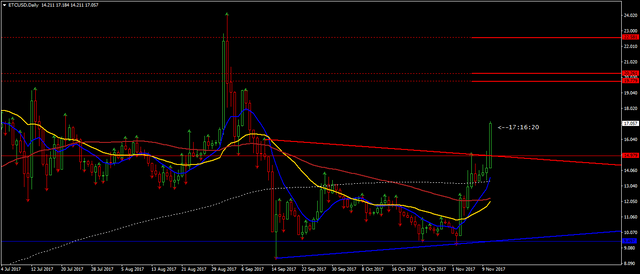
Is the best performer of all major ALT CC's and it is headed to a minimum of $20 per coin.
https://www.mql5.com/en/charts/7883135/etcusd-d1-simplefx-ltd
ETH
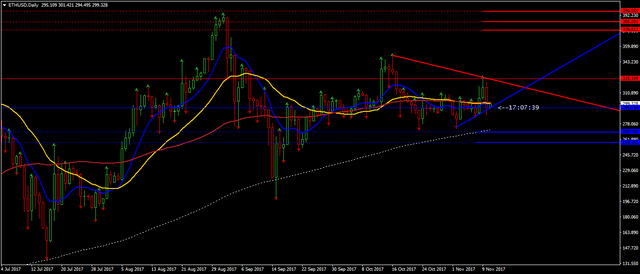
sits just above lower trigger level of $295. A daily close below it will see a continuation to 40 days WMA (White dotted) with possible overshoot down to $258. Otherwise for the upper targets to materialise we need a daily close above $325.
https://www.mql5.com/en/charts/7883144/ethusd-d1-simplefx-ltd
LTC
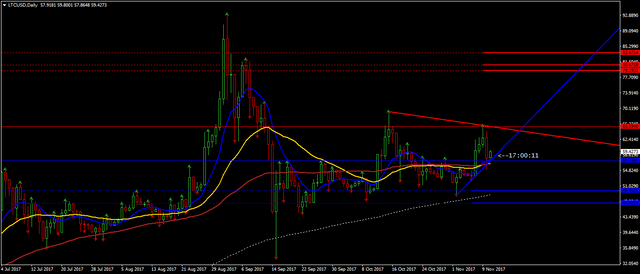
The same scenario as with ETH with trigger levels and targets on the chart.
https://www.mql5.com/en/charts/7883154/ltcusd-d1-simplefx-ltd
XRP
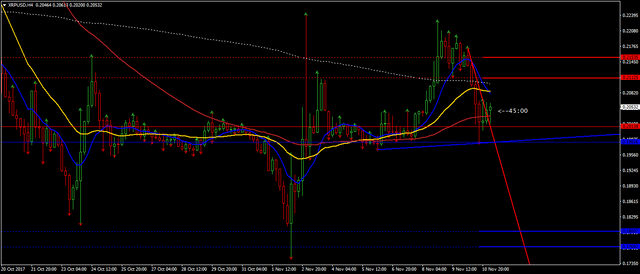
Established a pretty strong support @$0.19 and it is currently heading to break trough 4H 34 WMA and 40 days WMA (yellow and white dotted) resistance zone with a minimum target of $0.21. Otherwise losing support @$0.19 on 3 consecutive 4H closes opens up lower targets of $0.17-0.18
https://www.mql5.com/en/charts/7883184/xrpusd-h4-simplefx-ltd
BCH
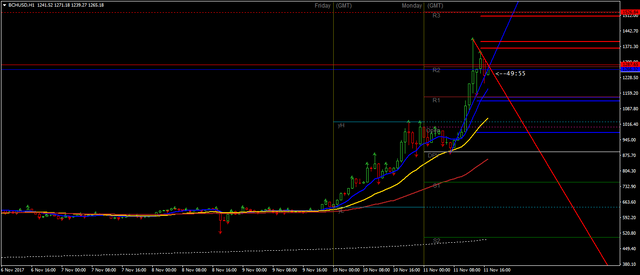
should at least correct to R1 @ $1140. The price/time geometry though implies equal chancies for a continuation upwards to R3 @ $1526
https://www.mql5.com/en/charts/7884635/bchusd-h1-simplefx-ltd
a technical perspective over the BCH when data is available would be much appreciated
Hi @srezz thanks for the TA. What do you think about BCH ?
I've added BCH to my market overview.