The Volatility dried out
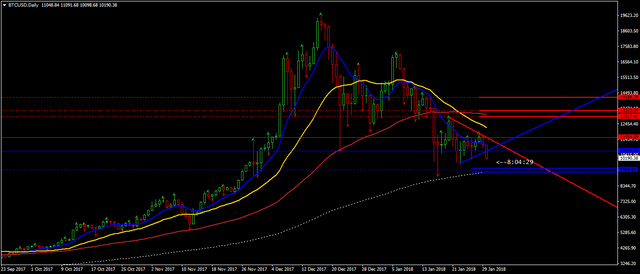
and it looks like before attempting to test the newly established strong resistance around 89 days WMA Bitcoin is to make another attempt to break below 34 weeks WMA (white dotted). However, the volatility implies targets right on the top of it.
https://www.mql5.com/en/charts/8241617/btcusd-d1-simplefx-ltd
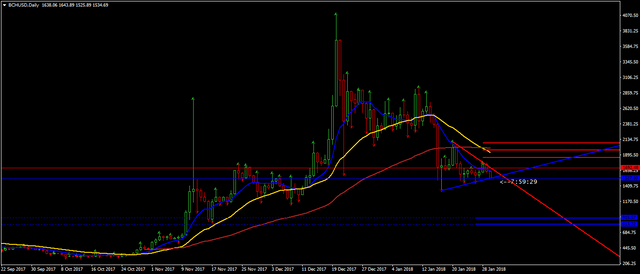
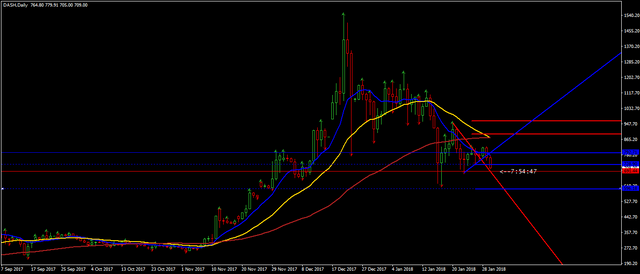
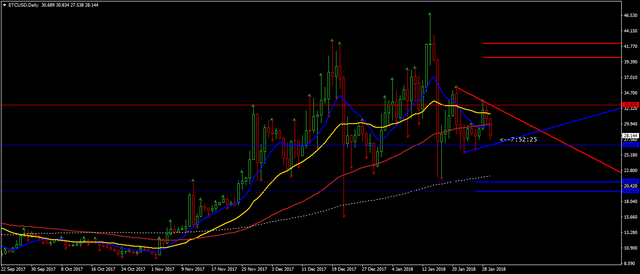
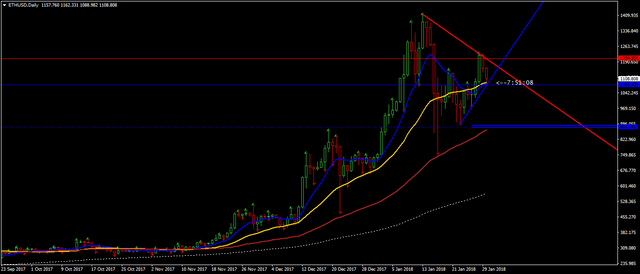
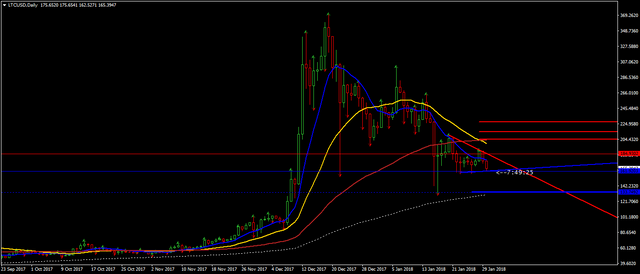
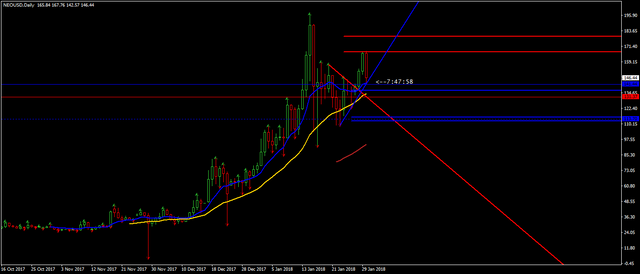
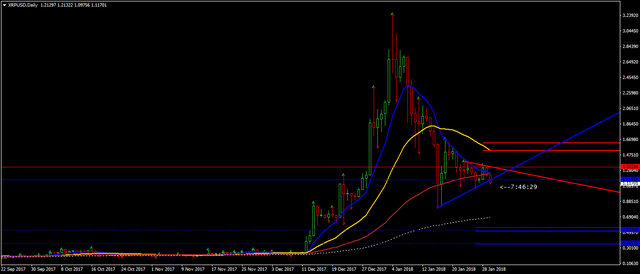
The major ALT coins are in direct correlation with BTC and their trigger levels and volatility implied targets are on the respective charts.
BCH
https://www.mql5.com/en/charts/8241648/bchusd-d1-simplefx-ltd
DASH
https://www.mql5.com/en/charts/8241672/dash-d1-ava-trade-ltd
ETC
https://www.mql5.com/en/charts/8241683/etcusd-d1-simplefx-ltd
ETH
https://www.mql5.com/en/charts/8241685/ethusd-d1-simplefx-ltd
LTC
https://www.mql5.com/en/charts/8241695/ltcusd-d1-simplefx-ltd
NEO
https://www.mql5.com/en/charts/8241702/neousd-d1-ava-trade-ltd
XRP
https://www.mql5.com/en/charts/8241706/xrpusd-d1-simplefx-ltd
@srezz Can you please provide an explanation on how to interpret your charts?
Thanks
so thing is this, Steem has not figured out how to pin a post to the top. so Srezz has to repeat the answer to this about every 4th post. look through some old post and read the comments.
the red and blue lines in the middle are the channel the the price will bounce around in. if it has a close above or below this channel. then the dotted line is the target. so BTC short term target is 9,414 if it hits this it may bounce from here.
if it continues to drop then check you last weeks post for the approx next target down in the 6k range.
charts are valid for something like 12 weeks and or if the expected has happened.
Thank you bsbeers. Have answered your questions.
A small correction - it's 12 days, not weeks
@srezz alongwith 34 weeks WMA, 200 days WMA (which is currently at 10k) have been a major support for past two years. BTC have been bouncing from 10k for quite sometime, let's hope it would bounce back from 34 weeks WMA as well.
Bitcoin looks very heavy to me. Especially the last bounce off the 34 weeks WMA before the current drop. Usually the market oscillates between the nearest WMAs. So, when it bounces off the 34 WMA most of the times it revisits the 13 WMA. This is what I expected to happen in my previous market update. But it was not the case. Therefore I conclude that we are going to be bouncing around the 34 weeks WMA ( or in your terms 200 days WMA) until we brake below it.
welp, I have buys placed in the $9,400 range.
If btc goes through this and keeps dropping well i guess i'll just keep catching the falling knife.
I really hate to bet against BTC tho.
i figure even if it drops to the 5k range i'll just have to sell some long term hold stocks, to grab more coin. not together an all bad thing in my book.
I have some health care stocks, that i'm itching to sell. i really hate that industry. i rather have those funds in crypto.
thx for sharing your opinions with us Srezz.
@bsbeers I know it's a good price to buy BTC but still putting everything in one basket sounds like a terrible idea. As they say always fear the bear. Thanks
@govindsaria my target it 100k for 2020.
So if I’m in the red for a few mounts of this year I won’t stress it. Also I will use part of the btc to purchas alts.
I have the additional funds to move over if btc drops below 8k. I bought In he 12-14k range and I’ll buy more in the 9k range and I’ll buy more between 5-8k
Really if in 3 years btc is close to 100k. Wether I purchased at 5 or 10k won’t matter as much as actually purchsing.
Here we are. And BTC still f*in' heavy. To break or not to break ?
So we've hit the 34 week WMA targets. Yet to break $9,000 big even. But volume and action signals weak support (no significant rush back in or strong bounce). Seems to me lower lows will be tested... Any insights @srezz what the next train stop is?
We would need to consolidate today's losses. Then the next stop is $7660 +/- $50 depending on the data feed.
Hey @srezz , which support level indicates 7660?
It's the 0.618 Fibonacci retracement level of the the entire move from the low on the 11th of Jan. 2015 to the all time high on the 17th of December 2017 ( from $163 to $19704 in my data feed).
Thanks :)