A thought to share
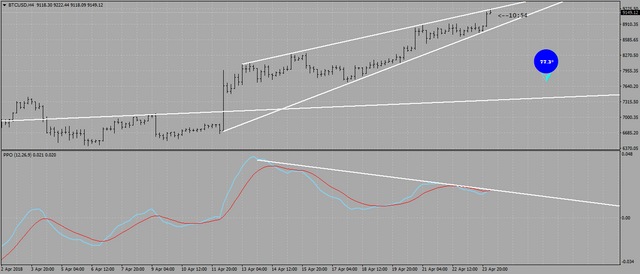
If one looks at Bitcoin on the 4h chart there's a clear rising wedge which combined with the PPO indicator displays a pronounced divergence between the price action and its momentum.
https://www.mql5.com/en/charts/8603052/btcusd-h4-simplefx-ltd

What it simply means that we have a pull back on the cards for those who missed the train.
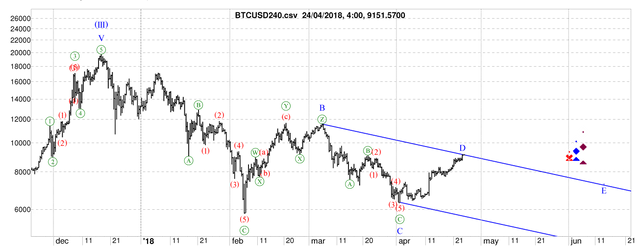
If expressed in EW terms we have either completed (or soon be completing) wave D in ABCDE pattern that the entire correction has morphed into and will have a final truncated push down in wave E
https://ibb.co/mApJ1x

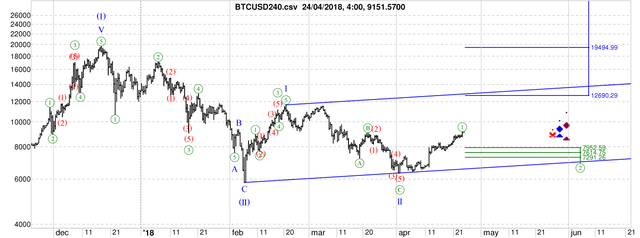
Or this rising wedge is the 5th wave of the 1st wave of wave III of (III) and we will be pulling back in wave 2 of III of (III)
https://ibb.co/iybTZH

In any case I expect at least 50% retracement of the current swing up and for those who missed it, the Orient Express will soon make its final stop.
ADDON
The vedge has broke to the upsite, - a rare but possible outcome with 30% of chances. The divergence has also flattened, but it's still there.
https://www.mql5.com/en/charts/8606656/btcusd-h4-simplefx-ltd


Hi,
I've been reading your posts for some time, as well as some other TAs. But over time I've filtered to only a few left as some are not as good as I initially thought. Mainly because some are just too arrogant, for example there was a guy who dismissed the possibility of going lower than $10k back when BTC was briefly over $10k and then came crashing down to the recent $6k level. I do like how you offer both views and I recall one of your post saying that even if BTC hits the $16/17k area it could still fall down to quite low.
Now I do have two questions for you:
1: I've read analysis on the comparison of this 2018 correction to the 2014 correction and I've also done a post on it. There does appear to be a lot of similarities and if history does repeat itself then we may see a lower low, i.e. below the $5.9k set back in Feb. Now you recently called an end to the bear market...but do you think theres still that chance?
2: Regardless of whether another lower low happens or not...do you think BTC will see an ATH this year?
Thanks
Nothing is certain in the markets and if you ask me whether it's possible to repeat what happened in 2014, my answer is - yes. Is it likely though? At this point in time, and I repeat, - at this point in time, I think it's unlikely. Why? 1). Because the market is still heavily oversold and needs to go up to correct its technicals and as it goes up more and more new money that currently sits on the sidelines will be joining in. And I'm talking about institutional money. 2) The Awareness of CC market and available tools (Futures, - remember?) today is very different to what it was back in 2014.
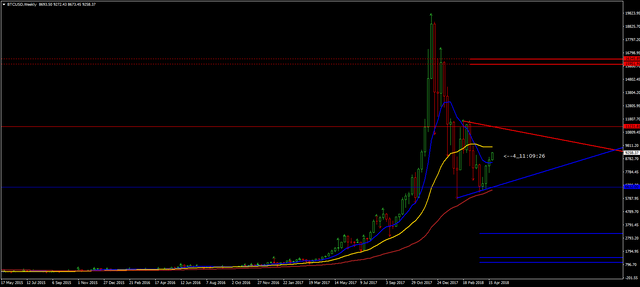
My guesses are as good as yours. Technicals though at this point in time do not permit the previous ATH even if we recover above the weekly bull trigger line @ $11232
https://www.mql5.com/en/charts/8604432/btcusd-w1-simplefx-ltd

Yes, I admit, my call for the end of correction may well be a bit premature. But it doesn't automatically mean that we will go below 6K. Neither it automatically means ATH. We may be in a wide range for quite some time.
Srezz as always thank you.
Quality questions and comments above. Nice follow up
Re your last comment. No don't worry, I agree....even if BTC is out of correction it doesn't mean it'll set ATH...I think the least it means is no lower low. To me thats quite important. Lets see what happens.
Sure.
Crypto. Never boring. Thx for the addon
A great call again. Thanks srezz!
Thank you for sharing. I'm hopeful our destination is Shangri-La...
@srezz, you're the man. Many thanks!
crytocurrency market is up and down continiously.thanks for share...@srezz
I guess we can see the same divergence in the MACD, even in the 1h timeframe.
It's less pronounced tough.
Thanks Srezz for the update.
thanks!! but sir, what about the market cycles
what about them? The market reacted to 34 weeks WMA (yellow)
https://www.mql5.com/en/charts/8614718/btcusd-w1-simplefx-ltd

I've been searching through your older posts, but couldn't find the information on this. Besides the yellow line being the 34 weeks WMA, what are the other two (blue and red lines in this case)?
They seem to work quite well as dynamic support/resistance levels, so I'd be grateful if you could share that vital piece of information.
And thank you for all these updates, they are very much appreciated.
Blue - 13, yellow - 34, brown - 89.
89/34 = 34/13 = 2.618 = 1 + 1.618
I hope I don't need to explain what 1.618 represents.
Thank you!
1.618 = Phi, golden ratio (among its other names).
Thanks for clarifying.