High-Flyers and Shitcoins: What I Learned from Analyzing CoinMarketCap Data in Google Sheets

CoinMarketCap.com has grown to be one of the most popular websites in the world.
With cryptocurrencies going bonkers in 2017, readers flocked to the website on a daily basis, getting rapidly updated on market capitalizations, daily volumes, prices, and new coins added to the mix.
The market has attracted 100's of billions of dollars, and sprouted a whopping 1,200+ different coins (the majority of which are different from one another...I say majority, because of copycat coins).

But using the site for actual analysis is...difficult.
Spreadsheets allow us to do quick and dirty analysis that can be limited from a website, or too cumbersome to code. Everyone knows how to use it, it's easy to store data, and it includes many powerful formulas.
After setup, we will have a simple dashboard that will give even quicker insight into what coins are the big gainers and movers.
Here’s what I can guarantee you:
- Several high-level insights into the cryptocurrency market
- A better understanding of how the Spreadstreet Google Sheets add-in can make analysis easier
- Instructions on how to set everything up yourself
Why should I use a spreadsheet? Why not just use the site?
CoinMarketCap.com is one of my favorite websites, but a non-programmer struggles with getting the data on the front page into the analysis tool of choosing.
They offer an API, but most non-programmers do not know how to use an API.
What if I want to see the top gainers and losers at different market caps? I have to go through multiple steps in order to achieve this, whereas after a one-time setup in Google Sheets, I am good to go.
Google Sheets has a plethora of advantages.
- It is easy to use and learn
- It is a lightweight and straightforward way to store data
- The formulas are powerful and plentiful
- Sharing with friends and customers is a piece of cake
- Querying a dataset is super easy with Google Query Language
If we can properly setup the sheet, we can save many hours a month not having to copy data, paste into spreadsheet and spot check.
Pulling in CoinMarketCap data to a Google Sheet
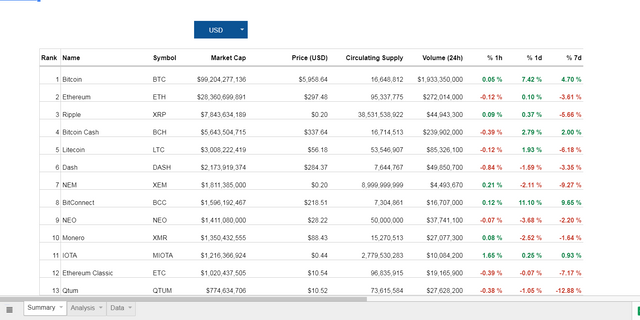
For this analysis, I will be pulling in the full breakdown of coins from CoinMarketCap.com into Google Sheets. I will be using the Spreadstreet Google Sheets add-in, Twitter, Reddit, and my (small) brain.
The sheet will include the following:
- The CoinMarketCap coins breakdown that you can find here
- % Gainers > $10M
- % Gainers > $100M
- % Gainers > $1B
- % Losers > $10M
- % Losers > $100M
- % Losers > $1B
Please note that nothing in this analysis should be construed as financial advice. I highly recommend you draw your own conclusions by following the "Implementing this analysis yourself" section.
If you would have invested $100 in Blocktix last week, it would be worth...
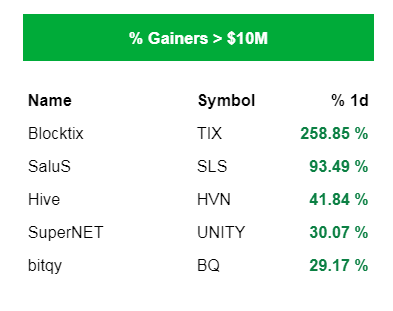
The coin with the largest price movement of the past 7 days is Blocktix (and actually, it had most of this move in one day, on Oct 26th).
Blocktix is an Ethereum based, counterfeit-resistant solution for individuals and event hosting businesses to distribute, advertise, and transfer ownership of event tickets or passes. Turns out, if you would have invested $100 in Blocktix on Oct 25th, it would have been worth ~$650 at it's peak. (the picture above was taken after the peak...258% is still pretty damn good)
So what the hell was going on? Why did it jump so much?
Let's take a look at some recent news. Head to the social tab of Blocktix on CoinMarketCap:

Bingo. The announcement that Blocktix was going to be trading on Bittrex suddently skyrocketed the volume, and caused the coin price to dramatically increase.
But hopefully you didn't invest in Unobtanium...
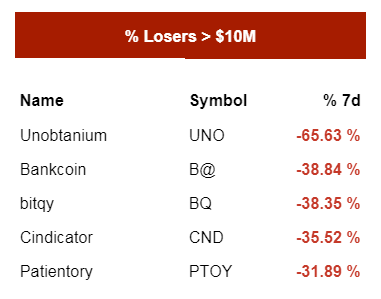
Not every coin has Lambo-like profitability.
Let's now look at the big losers.
It hasn’t exactly been a smooth ride for Unobtanium. "Unobtanium is a popular cryptocurency, designed to be fast, secure and rare. Due to low supply and fast diminishing inflation, it is an ideal store of wealth", according to the website. If you would have invested $100 earlier in the week, it would be worth a paltry ~$33 today.
Again, let's head to the social tab and see what's going on.
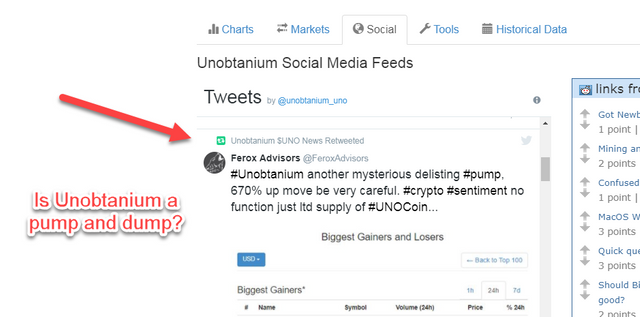
Back on the 19th, FeroxAdvisors reported on Unobtanium getting de-listed from Bittrex after a potential pump-and-dump.
This is actually a huge problem in penny stocks, stocks with low volume, and cryptocurrencies. With crypto being such a new industry, the prices are notably subject to volatile fluctuations. However, these methods go beyond traditional supply/demand inefficiences, and showcases the more malicious nature of a select few.
Exchange issues can cause unintended (positive) consequences
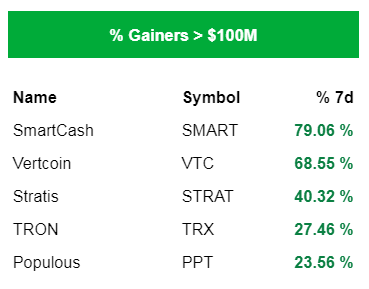
SmartCash was the leader in the $100M bucket, as they saw a week-over-week increase of 77%.
Cryptopia, one of the smaller exchanges, but a trading hub for SmartCash, had an issue where deposits and withdrawals were not working on the exchange.
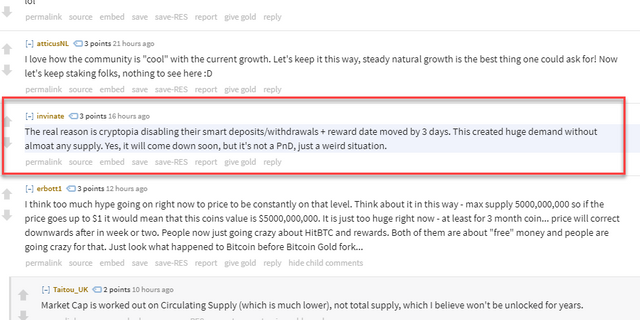
This caused a huge spike in demand, as supply plummeted, unable to meet the market needs (simple economics are simple!)
How you can get your very own CoinMarketCap dashboard in Google Sheets
If you haven't already, install the Spreadstreet for Google Sheets add-on from the Chrome Store.
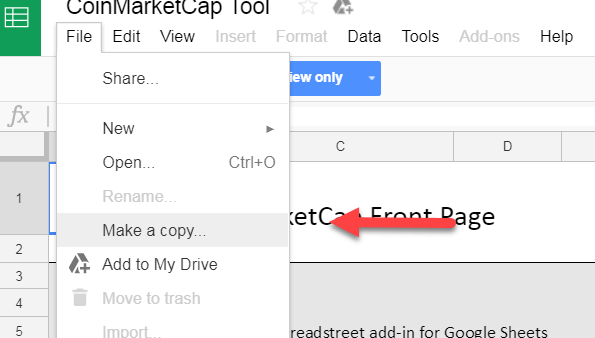
Step 1: Make a copy of the worksheet. Click the picture above, click on File - Make a Copy
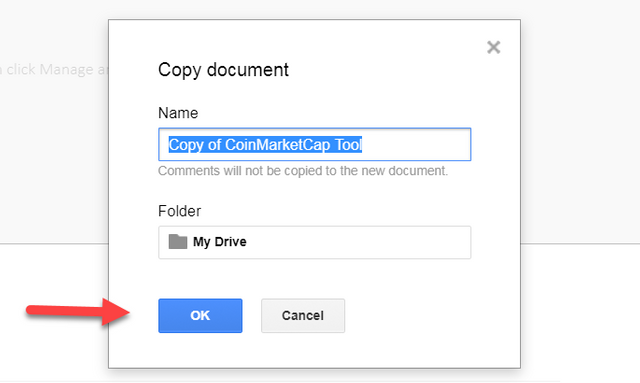
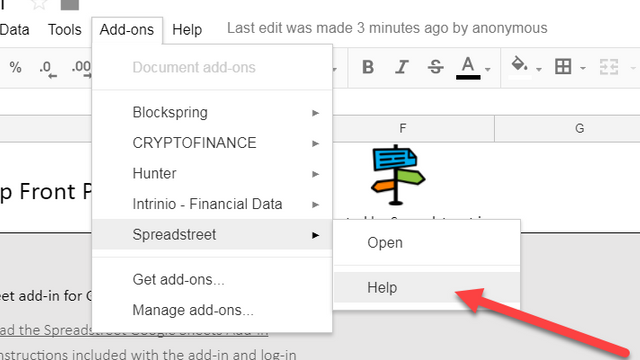
Step 2: Open the template, click the menu Add-ons / Spreadstreet / Help
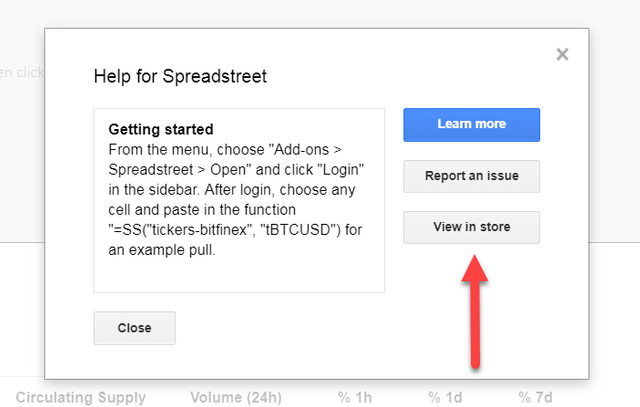
Step 3: Click "View in store"
Step 4: Important Click Manage and in the dropdown menu click "Use in this document"
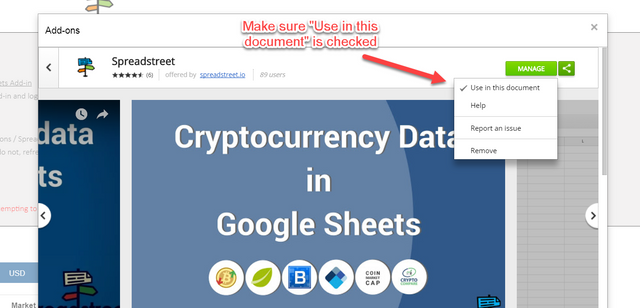
The numbers in the spreadsheet should now update. If they do not, refresh the template. The CoinMarketCap data includes 1,200 coins, so the pull can take a few seconds before it populates the "Data" tab.
Helpful resources
Download the add-in: https://spreadstreet.io/tools/google-sheets-add-in
Help: https://spreadstreet.io/docs
First time install and login:
CoinMarketCap ticker endpoint help: https://spreadstreet.io/knowledge-base/coinmarketcap-api-ticker-endpoint/


Hello, thank you for the post!
Thanks, Tammy :)
You're welcome! I have added you to my follow list!