Technical Analysis: BTC-XLM. LUMEN Uptrend incoming!
Buy at 0.000037
Sell at 0.000038
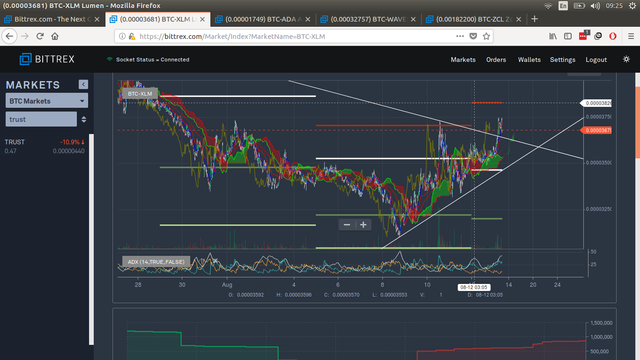
30-MIN CHART ANALYSIS
We see that, since the 9th, XLM has gotten quite a boost even if it is short term, judging by the daily charts. Basing this analysis on the 30-min chart, it's following a wedge formation and it has just broke out of it.
The question now is: Will it keep increasing its price or will it drop? Let's look at the indicators.
ADX: This shows tendency strength. Anything over 25 means the trend is strong. It sits at 42 for the current position, and it concurs with the Ichimoku clouds.
Ichimoku: The price has remained relatively faithful to the clouds. Remember that the clouds form before the price manifests itself at that time frame. On the current position, the cloud remains green, which means uptrend.
Pivot points: This morning XLM slightly surpassed the previous resistance at 0.000037, and we know that resistances tend to become support and viceversa, meaning that we get our sell position from the expected resistance level. Furthermore, check how the wedge came to be on the daily chart:
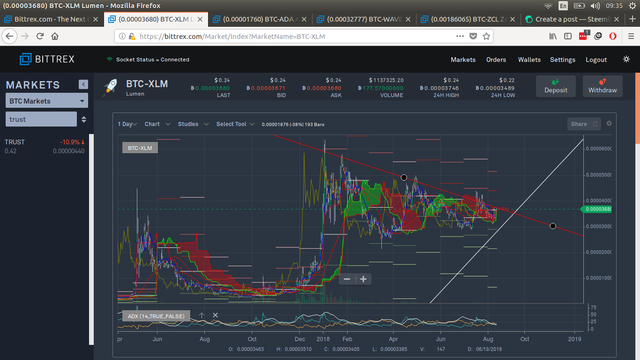
It may not reach 0.00004, but, by using a strict wedge, we can expect at least a confirmation, whether it is going up or down.
Follow this analysis at your own risk. I do not make myself responsible for any losses or gains of others than myself.