AntShare and Technical Indicator: RSI
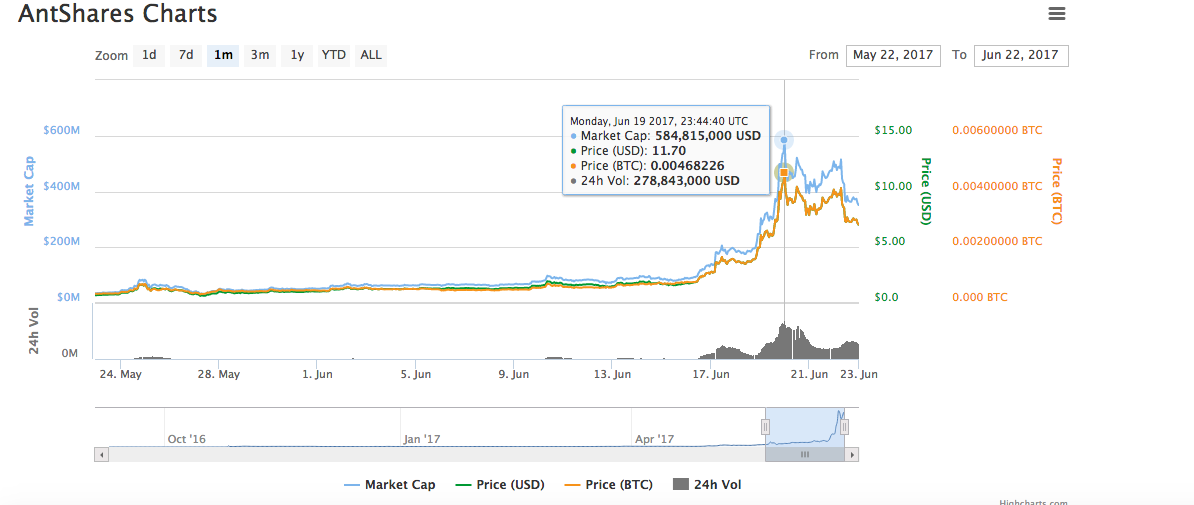
Antshares (ANS) has been in the headlines quite a bit these past few weeks. This is most likely due to the huge gains it has had this month running from $.80 to a high of almost $12 on June 19th.

While this Antshares is a really neat Chinese based smart-contract platform, I am immediately skeptical of any 1000%+ in such a short period. Even if the price increase is sustainable in the long term, there is almost always a major pullback. Fibonacci retracement levels have been quite accurate at predicting the price pull backs in the runs of ETH and BTC put I will save that for another day.
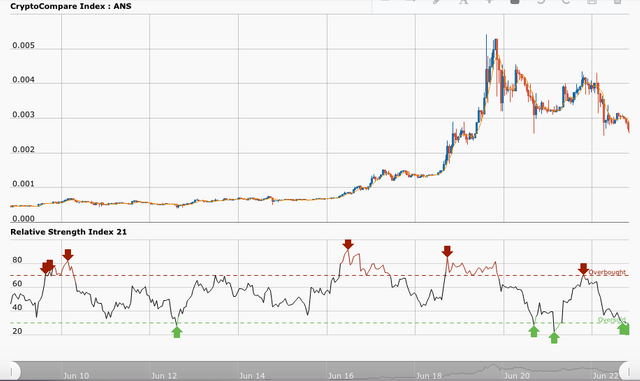
One of the simplest (but most accurate) technical indicators is the Relative Strength Index or the RSI. RSI measures the momentum of an asset. A value of above 70 signifies that the asset is overbought while a value below 30 is indicative of an oversell. Since the cryptocurrency market trades on 15% fact and 85% hype and emotion, momentum is usually highly correlated with price movements.
Examining the 2 week graph of Antshares we can see that in most cases, the RSI has accurately predicted the highs and lows of the price. As you can see now, Antshares is currently at a RSI below 30 indicating that it could a potentially undervalue asset making it worth noting for an investment opportunity.

As always, never make an investment decision that you don’t believe in yourself! Do your own due diligence, knowledge is power.
Let me know what you think will happen to the price of Antshares in the near future.
GLTA
-Spins
thanks to coinmarketcap.com and cryptocompare.com for the lovely graphs and data
Interesting to learn about RSI. I got a little ANS when it was around $1 and was quite surprised by the quick boost. I was wondering where it might find it's balance. Fibonacci is such a fascinating concept. It's so interesting how it applies to most aspects of our lives. Thanks again for your thoughts!
RSI can change on a dime. ANS the ETH of China. Market cap right now $333m. ETH $31b, do the math. Buy.
Everyone is selling off in an excited frenzy after 10xing their initial investment. I was hesitant to buy in at $9 but as it continues to drop and drop i'm looking for a good entry point.
Did you have any ANS before the spike?