LTCUSD: Triangle Breakout Can Lead Back To 300?

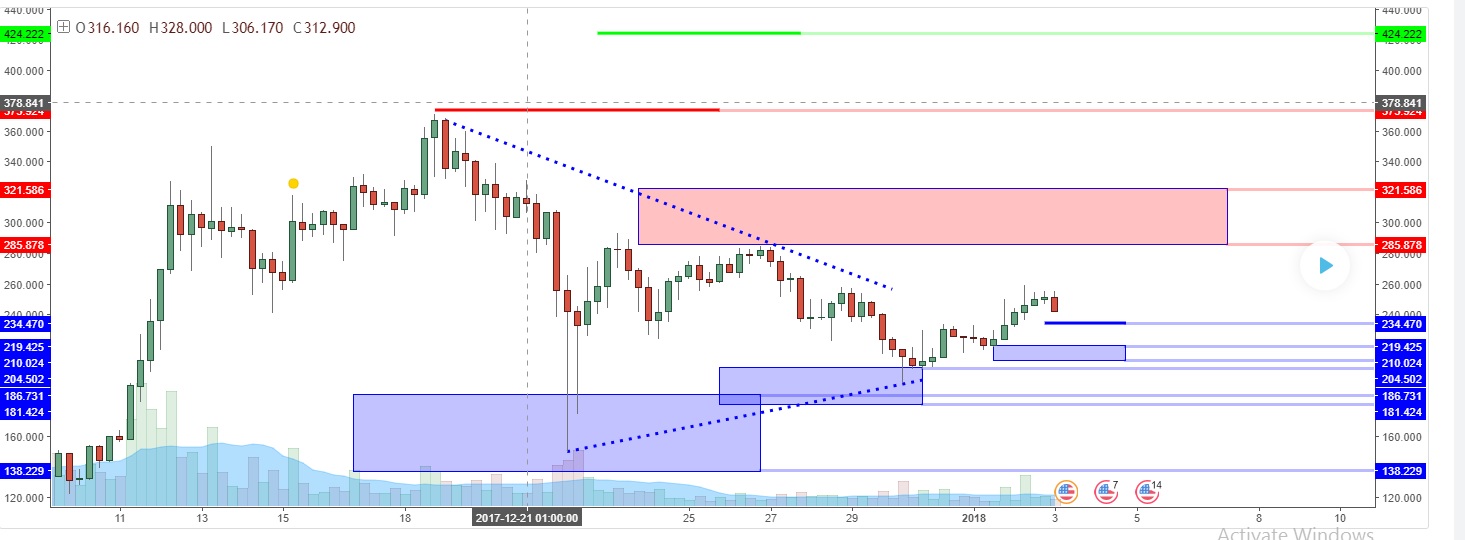
Consolidation breakout occurred with price now trading just under 250. At the moment, based on the current structure, momentum is bullish and is more likely to work its way into the 285 to 321 resistance zone .
Just like BTC 2.25% , this market has formed a higher low in recent price action which is clear momentum reversal. This formation has lead to the breakout of a triangle that has been developing for two weeks (since the 370 high.) The focus now is on the potential retrace levels that would offer an attractive reward/risk opportunity to go long.

As I write this, price is hesitating within a mini consolidation (a series of inside bars) which is taking place within the area of a previous peak (257.40). This minor resistance can lead to a retest of the 234 level which is the .382 of the recent bullish structure, or the 219 to 210 support zone which is the .618 area relevant to the same structure. These levels are minor supports but do provide prices to watch that offer more attractive reward/risk compared to where price is now.
IF price can retest these areas, a reversal pattern or higher low (just like the one in place around the 220 area) would be the justification to go long. As you can see from the chart. the target is the 285 to 321 resistance zone which is the .618 area relevant to the recent bearish structure. Price has been staying within these broader resistance and support zones which has lead to the triangle that is now obvious on the chart.
Risk will have to be measured at the time the bullish reversal pattern occurs. What to avoid in a situation like this is premature entry. IF price falls through the oncoming supports, then it is more likely to test the low 200s or even the 190s for a possible double bottom formation. That scenario would offer the most attractive buying opportunities, especially for longer time horizon trades.
In summary, the levels that are projected on this chart offer a better possibility of where price can react or reverse. They provide reference points where you can anticipate price action rather than react to it. The key to using this information effectively is to observe and evaluate the outcome of the price action at the time the levels are reached. Not jump in blindly. What you are looking for is price action to prove it is more likely to follow the anticipated scenario and that often unfolds in the form of a reversal pattern. The hardest part is WAITING in the face of building emotional pressure and impulse. By letting the market prove itself, you at least align your thoughts and actions with what the market is more likely to do rather than what you think.
source: https://www.tradingview.com/chart/LTCUSD/qD2IWdqC-LTCUSD-Triangle-Breakout-Can-Lead-Back-To-300/