Bitcoin Price/Where To Look Next

To say that it has been a wild day in the bitcoin price space would be an understatement. Overnight last night, we saw bitcoin break through the $10,000 mark and, in doing so, we saw it bring down a long-term upside target and one that many have suggested in the past that bitcoin would never be able to reach.
Almost immediately subsequent to this break, however, we saw price carry through to break further resistance levels, eventually running through $11,000 before correcting substantially towards current prices in and around $10,700 apiece.
Where this exuberance will stop remains to be seen.
There is a good chance that the correction we saw early evening out of Europe is not the only correction we are going to see and that – in turn – we might be in for something much more severe going forward.
We are going to set up against the markets as normal, however, in anticipation of some relatively volatile intraday action.
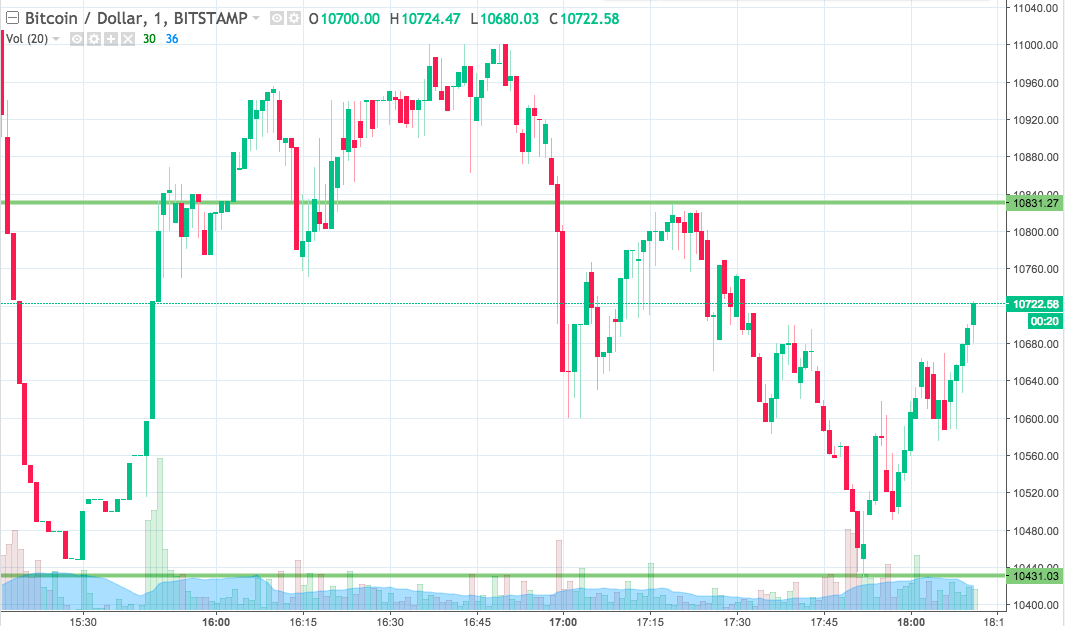
So, with that said, and as ever, take a quick look at the chart below before we get started so as to get an idea where things stand and where we are looking to jump in and out of the markets according to the rules of our intraday strategy. The chart is a one-minute candlestick chart and it has our key range
.png)
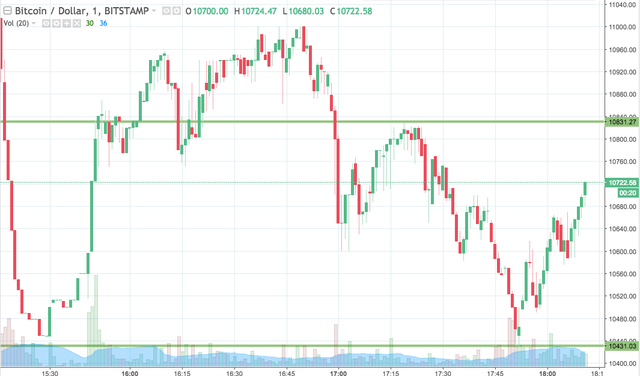
As the chart shows, the range we are looking at for the session tonight comes in as defined by support to the downside at 10431 and resistance to the upside at 10831. This is far wider than normal but we are going to stick with our breakout strategy nonetheless.
If we see price close above resistance, we will enter long towards an immediate upside target of 10900.
Conversely, a close below support will have us in short towards 10360.