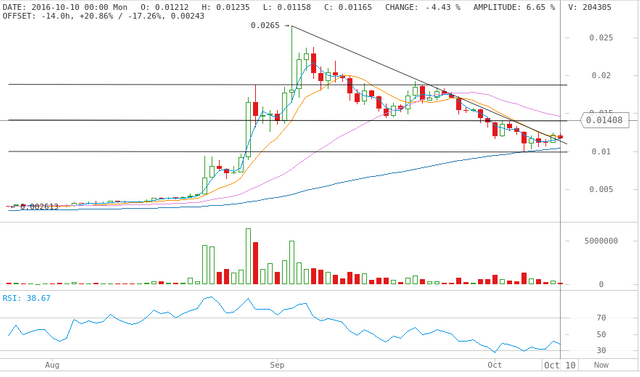
XMR/BTC Daily Chart 10/10/16
It looks as though XMR/BTC may have finally broken through the downward trend line that was acting as resistance. If tomorrow's candle fails to close back below that trend line, I would expect to see the price lift off and test the 0.014 level. 0.014BTC should act as pretty significant resistance, but a break through this price level would leave nothing standing in the way of a rally to ~0.0187.
As always, any sudden change in fundamentals, (or at least perception of fundamentals), can immediately invalidate any technical chart analysis. As I noted in a recent blog post, XMR has been the target of a lot of negative coverage lately.
Also to note is that a close below the downward trend line on this chart will most likely mean a re-test of 0.010BTC in the near term.
Disclosure: I am currently holding XMR. I am also contributing significant hashrate to the XMR network and adding these mining profits to my portfolio. I intend to hold a sizable investment in XMR for the long term. I believe strongly in not only the future profit potential of XMR, but also the vision of its developers. I am not affiliated in any way with the technical development of the Monero Project.