The Infamous Verge (XVG) Triangle - It Broke down - Now What?
Roughly a week ago there was some analysis from a super active user I'll leave nameless. It was on Verge (XVG) and the crazy upside it had due to a triangle pattern.
Here's the Thing - I had no issue with the one side of analysis and agreed with it!
But that's the problem - it was only one sided.
When it comes to technical analysis and charting you must do two things:
- Layout scenarios for the upside
- Layout scenarios for the downside
Otherwise you are not doing your readers justice as they are not learning how to react to both directions.
Break down of Triangle Pattern
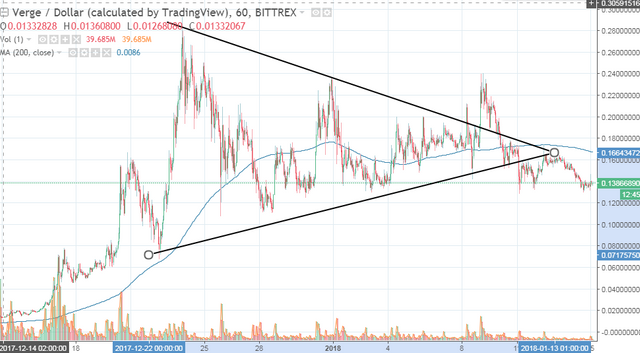
Above is the hourly chart of XVG with the triangle I drew back when the analysis was done.
You can see it tried to break out of the triangle to the upside. This would have gave us the possibility of a large upside move. However, it failed to follow through.
Generally when you get a breakout there will be a pullback many times that tests that descending line it broke. In this case XVG failed and re-entered the triangle.
The Break Down And Confirmation
Not long after you see price bounced off the bottom ascending line only to then fail and crack below it.
What happened next should be expected. It bounced and tested that descending line. After multiple tries it could not re-establish above and has now pushed back down to the prior low around .13 cents.
The Lesson
If you buy a breakout more than just the upside profit target needs to be known. What does one do when the price breaks down as it did.
Do you exit and take a small loss once it falls back into the triangle? Do you use the ascending line as a stop loss and only sell if it completely breaks down out of the triangle to the downside?
The answer is yes ans yes. Either one works depending on your risk profile and the risk-reward ratio you have based on whichever upside target you picked.
However, you should be aware of those and I feel like when they are not mentioned it is doing a disservice to readers. Not saying I'm never guilty of not analyzing both sides....but TA just to rah rah rah coins leaves a bad taste in my mouth.

Learn to Invest Like The Cat

Best Regards,

Disclaimer: All content in this post is my opinion and for educational purposes
Appreciate you adding the "rest of the story". Missing so often in the flood of "analysis" I see on the platform.
Reminds me of the sage advice of asking yourself "what is the most I'll lose?" rather than "how much can I make?".
Yes, need to answer both those questions before entering any investment.
Looks like there's still some room to play with in the wedge formed on the 4 hour chart. Funnily enough this is very similar to what happened to Ripple at the $.25 price point before it went up to incredible new highs. I think this will be a similar situation, but not as potent.
In the chart below, the bottom trendline has been tested 4 times (and including 1 close call), making it a very strong support. Looking for a bullish move but won't enter a position until a confirmation breakout (multiple times it wicked out of the trend line).
I really do need to add this 4 hour chart to my repertoire, seems to be working great for cryptos.
Appreciate you sharing the analysis, good stuff! :-)
No problem!
Charting on the 4 hr and drilling down to the 1 hr has given a really good snapshot with potential trades. Plus its easier to find fib areas with the 4 hr charts, which work great in Crypto as well (seems like you've used them).
I've always said that without a comparison to similar investment assets, you can make any turd shine.
In much the same way, you have to look at technical analysis from multiple angles.
Good work and
I want your opinion about the future of crypto currencies in 2018.
Thnx
I hate lines and triangles on charts. Too many people put too much stock in them. They are one indicator, but not the only indicator. :(
Agreed. Many indicators out there. Many of them are driven off of price data so I generally keep it simple and just look for support/resistance and reversal patterns coupled with volume. It has served me well in crypto.
I'll look at fibs and elliot if I am struggling to find targets since I understand all that, but for me KISS approach is working best.
Been in on Verge for a few weeks now. Just from a TA perspective and not counting any news/fundamentals, what pattern are you looking for before the next rise in price?
Not really looking for a pattern, but if you remove all the lines it is basically in a range of .12 to .24 in USD of late. So holding above 12 cents is ideal and then upside to 24 cents. Until I see it break out of that range nothing else for me to really do. I'm holding for now.
Reports and analyses must be balanced to be deemed as complete and dependable.
I appreciate very highly the content of your post. It has educated the steemians to a large extent, please keep it up. I follow and upvote you.
Thank You
thank you for your valued insight @scaredycatguide
@scaredycatguide You're argument has a lot of merits.