Cryptocurrency Trading - Fundamental & Technical Analysis - Basic Indicators and BTC/USD Chart

How To Value Cryptos
Cryptocurrencies are a new kind asset that often seem like mix between a currency and business stock so a traditional fundamental analysis(FA) can be a bit tricky. Things to consider include the supply and demand for the coin, the activity of the dev team on github, and the community on Bitcointalk/Slack/Telgram/Discord.
How to Buy Low and Sell High
Learning technical analysis (TA) of price charts to trade for faster profits in this crypto market does not take as long as you might think. Basic indicators are incredibly helpful. Trend lines, Fractals, RSI, Stochastics, MACD, and Simple and Exponential Moving Averages are some basic ways gauge resistance/support, momentem, and price direction. You can find charts that have these indicators available at https://www.tradingview.com/
It might sound intimidating, but its all very simple to get started and learn in a few minutes, then you can slowly add to and refine your knowledge over time, watching the market and seeing how well your indicators are working. By themselves, one of these simple indicators will probably not be reliably accurate, paying attention to 2 or 3 indicators can often give the educated trader an idea of the trend, notice of possible breakouts, and even entry/exit points for profitable trades.
Most traders only use a few indicators, so try not to feel overwhelmed by the sheer number of indicators that can be used to look for trades.
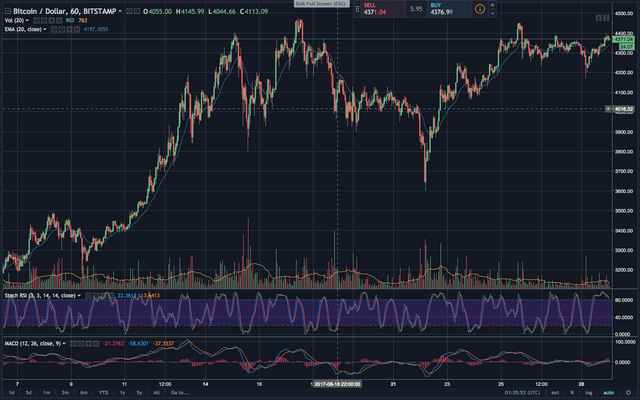
Free BTCUSD Chart from Trading View with 3 basic indicators that I made just now to give an example
Instead of showing perfect examples we will look at a current chart for BTC/USD to see what the TA is telling us currently for the Price of BTC/USD

Basic indicators used in this chart
- 20 Exponential Moving Average(20 EMA) Similar to Simple Moving Average(SMA), but with more weight given to the latest data. This is my favorite indicator as watching the price move in relation to the 20 EMA can often give reliable indication of price direction as in the blade runner strategy
- Stochastic RSI Oscillator that gives very clear overbought/oversold indications
- MACD Momentum indicator showing the relationship between two moving averages
**The market looks to be moving sideways as it has held close to and tested the recent ATH. With the MACD showing the momentum fairly flat, the Stochastic RSI showing it overbought, and the price starting to come back down to the 20 EMA, I expect the price to come down to the 20 EMA. **
The obvious Double Top could also be an indicator that the price will come down to a resistance level. I will be watching closely to see what the price does in relation to the 20 EMA.
Day Trading, Swing Trading, and Investing
- Day Trading Buying and selling an asset in the same day. Usually from paying close attention to technical indicators
- Swing Trading Staying in a trade over night or up to several weeks based on trends/news/TA
- Investing Much less time involved. Buying and holding for the long term based more so on FA
All three of these types of trading can be very profitable. A combination of 2 or all 3 of these strategies can be used depending on how long you want to stay in your trade or investment. Holding some coins for long-term investment while day and swing trading with a portion of your portfolio is a common strategy.
Sources:
https://www.coindesk.com/bitcoin-traders-know-fundamental-analysis/
https://steemit.com/altcoin/@romanornr/how-to-recognize-altcoins-that-are-trash-with-unskilled-devs
https://www.tradingview.com/
https://www.authenticfx.com/free-forex-trading-strategy.html
http://www.investopedia.com/university/technical/techanalysis3.asp
http://www.investopedia.com/terms/s/swingtrading.asp
http://www.investopedia.com/university/stockpicking/stockpicking1.asp
https://www.dailyfx.com/forex/education/trading_tips/daily_trading_lesson/2014/08/07/swing-trading-indicators.html
Good intro, not so much into day trading myself, assume you would eventually lose all.
As a scalper, I can never work without simple moving average.
It's my main indicator
Great post. I think it will take me weeks to digest it all with these links. Most of it looks greek to me at the moment. I think I'm going to dive into the bladerunner strategy and see if I can make sense of the instructions.
It sounds complicated but once you get into it, it's actually pretty simple. The bladerunner will be a great way to get started. Here is a post I made about it when I found it. You can't trade Bitcoin against USD on 1Broker anymore but the wallet still uses Bitcoin so it is still a great place to make profit in bitcoin trading forex! Today I have been using the blade runner to trade USDCAD and USDJPY https://steemit.com/trading/@richardcrill/trading-cryptos-and-forex-today-i-learned-the-blade-runner-strategy-and-started-making-money-with-it-immediately
the most important tools of TA for me are Trend Lines, Stochastics, and simple moving average
solid post
Glad I have you around to teach me the ropes! :)
very interesting
I am from Aceh, Indonesia
I'll just keep to investing in the projects I support, don't like all the hassle ^.^
This brief post is really so good for beginners to learn the main basics
Very helpful post great to see