Monthly numbers are in for February. Chalk up another ugly month
With February now on the books, we have now seen three consecutive down months and a 46% decline YTD. The only consolation is that most of the crypto market has seen similar declines.
With a monthly change of -26.6%, February squeaked past January as the 22nd worst month in Steem's history of 107 total months. There have now been 50 monthly increases and 57 monthly declines.
This month held a big surprise when the UPBIT exchange delisted the SBD and somewhere around 3 million (call it >20%) of SBDs were converted to STEEM using the blockchain's conversion mechanism. This conversion activity lowered the haircut price, and surprisingly (to me) downstream effects were to increase the virtual supply and daily token production. As a result of this high volume of conversions, we're now seeing daily production of 91,935 tokens per day - which I believe is higher than any value I've seen since I started watching that metric (surpassing the previous peak in Nov. 2023😉 that I had thought would be a multi-decade high).
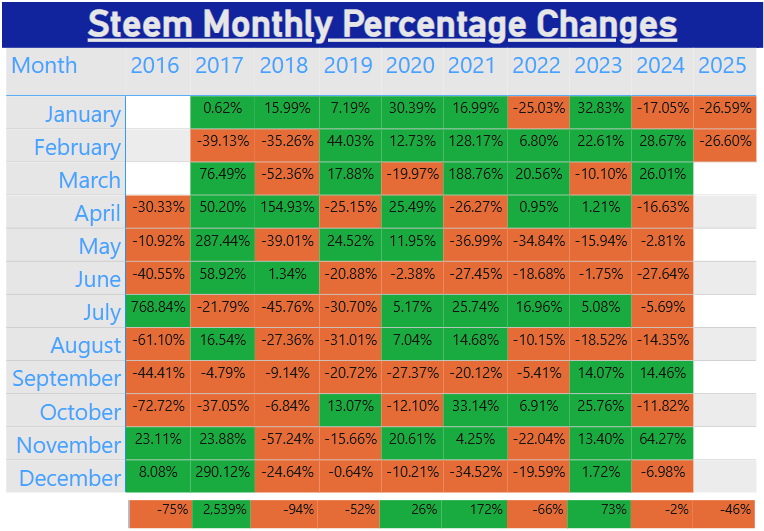
On to the visuals - in the first two visuals below, I added a new row for annual changes during each calendar year.
Here are the monthly changes, by percentage
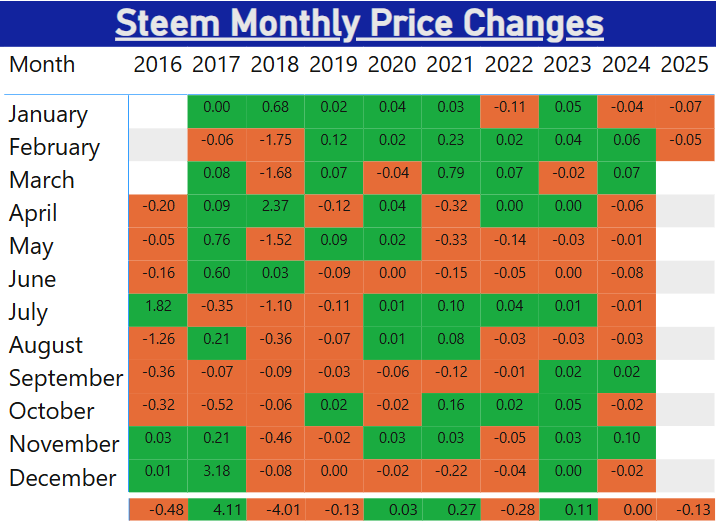
Here are the monthly changes, by value
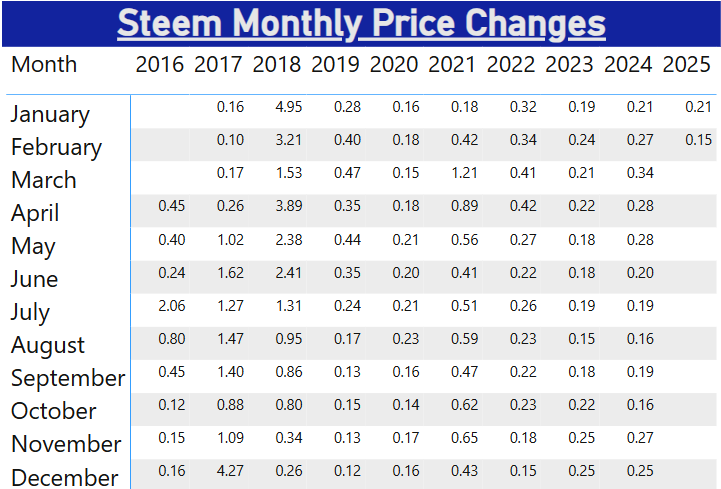
And here are the monthly closing prices
Looking at these charts, I'd guess that STEEM has mostly decorrelated from the BTC halving cycle, so our destiny is our own.
Fingers crossed for better markets in March.
Thanks for the info It looks like soon I can become a super whale at a reasonable price.
0.00 SBD,
0.27 STEEM,
0.27 SP
"Buy when there's blood in the streets." 😉
I have to get my S.S. first!
0.00 SBD,
0.13 STEEM,
0.13 SP
@mikitaly