Bitcoin vs U.S. Dollar: Cases of Volatility

What does the constitution and fiat currencies have in common?
It’s very difficult to effect a change in a constitution. In most cases, a constitutional amendment is only ratified after two-thirds of the House and Senate approve the amendment proposal. After that, lawmakers send the proposal to the states for a vote. Three-fourths of the states must support the proposed amendment before it actually makes it into the constitution. That’s a long and tedious process.
It also requires a long and tedious process to stimulate the foreign exchange market. Here’s how.
A recent study conducted by Bank of America Corp.’s Alice Leng revealed that foreign exchange trading — or forex, which essentially means the exchange or conversion of one fiat currency for another based on the values of each participating currency — now responds to shocks in the market less meaningfully. Even when the forex market responds meaningfully to shocks, it’s usually not sustained for a long period. It’ll potentially take six times the effort it took 15 years ago to stir volatility in the forex market today, Leng wrote in a note published Monday, Oct. 9. The low volatility in the forex market is obvious in that the JPMorgan FX volatility index is 12 percent lower than its five-average, according to a Bloomberg.
The recent low volatility of fiat currencies stands in stack contrast to Bitcoin, which has been criticized for its high volatility. Central bank or securities administration agencies globally have warned that people should be cautious of Bitcoin and other digital currencies mainly because of their volatility. But fiat currencies haven’t always been stable. Let’s dig a little into the volatility history of the U.S. dollar as a case study.
The U.S. Dollar
A good way to check the volatility history of the U.S. dollar is by checking the U.S. Dollar Index. The U.S. Dollar index tracks the value of the U.S. dollar compared to the values of a basket of six international currencies. Maintained by the ICE Futures U.S., Inc., the U.S. Dollar Index is geometrically averaged and tracks the value of the U.S. dollar against the euro, Japanese yen, British pound, Canadian dollar, Swedish krona and Swiss franc.
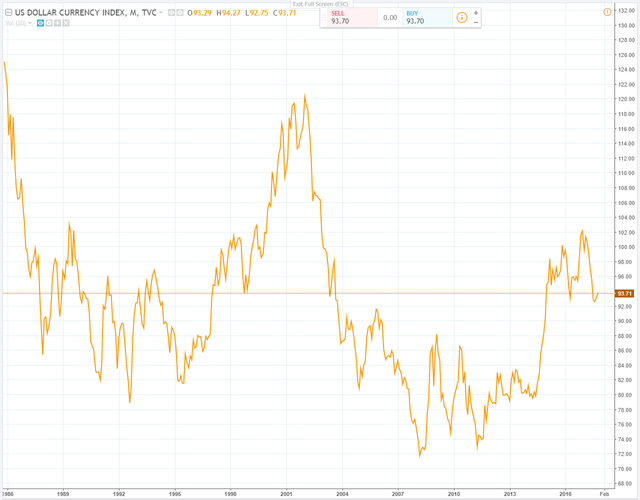
Chart of the U.S. Dollar Index since November 1985. Source: tradingview.com
Of course, that’s a huge chart and it’s difficult to make out anything from it. We’ll break the chart down into three different charts, each representing a decade to see the volatility history of the U.S. dollar. First, I would like to point out that for the purpose of this article we’ll be associating volatility to major, steep falls in the value of the U.S. dollar, since that’s typically the major focus when discussing the volatility of Bitcoin.
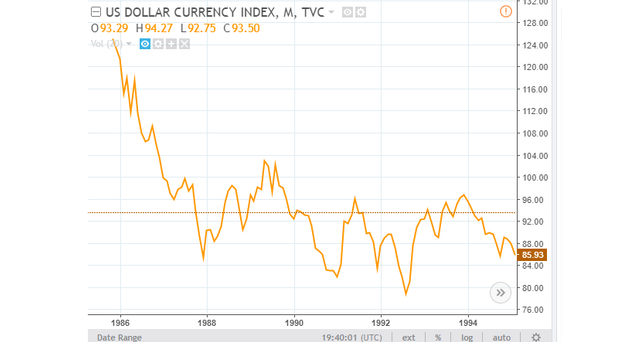
1985-1995
The chart above represents the decade between 1985 and 1995. The major sign of volatility in the U.S. dollar during this decade was the overall drop in the value of the dollar between 1985 and 1987 — around the period that the Latin America debt crisis hit. Within those years, the U.S. Dollar Index fell from about 124.99 to 85.42, a 31.7 percent decline. The value of the dollar didn’t quite rise in value for the remainder of the decade, on an overall basis.
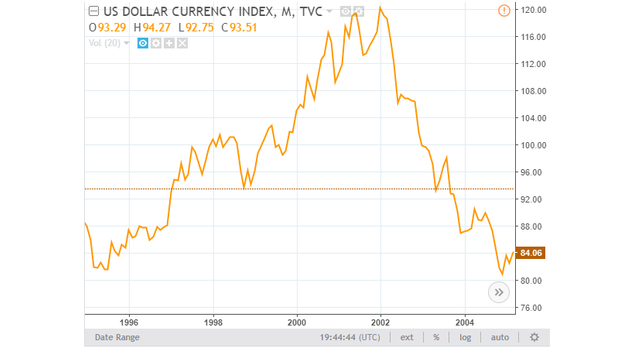
1995-2005
The chart above represents the movement of the U.S. dollar index between 1995 and 2005. The U.S. dollar, once again, showed signs of volatility during the period between Jan. 1, 2002 and Dec. 1, 2004, with the U.S. dollar index dropping from roughly 120.28 to 80.85, a 32.8 percent drop. This period coincided with the dotcom bubble.
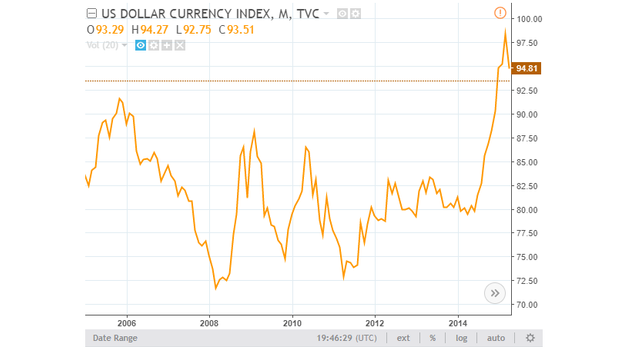
2005-2015
Finally, we’ll look at the decade between 2005 and 2015 as shown in the chart above. The biggest sign of volatility during this decade occurred between November 2005 and March 2008 — around the time that the last global financial crisis got serious. During this period, the U.S. Dollar Index dropped from about 91.57 to about 70.53, a 23 percent decline.
Please note that I’ve only looked into the cases of the largest volatilities in the decades we’re considering here. As the charts show, the U.S. dollar showed several signs of volatility during these decades. This is especially the case during the decade between 2005 and 2015.
Comparing it to Bitcoin volatility
Yes, I agree, this is an insane thing to do. But who knows what we might find. Again, for the purpose of this article, we’ll be associating volatility to major, steep falls in price.
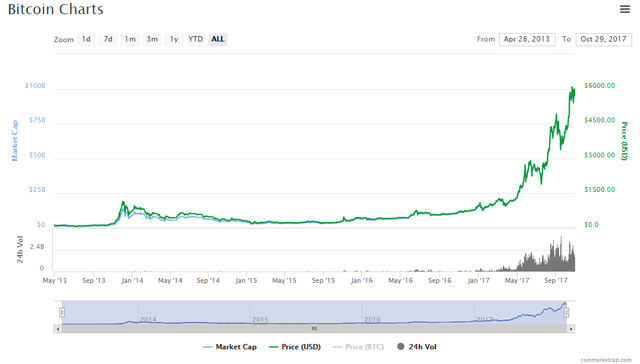
Since it was created in 2009, Bitcoin has risen from about $4.89 to record an all-time high of over $6,200, as of the time of writing. This dramatic rise is one of the reasons the digital currency is unpopular within most of the traditional investing community. Hello, Jamie Dimon!
Bitcoin rose on the back of a string of events, a major highlight being the approval of Bitcoin by the People’s Bank of China in November 2013. After the approval by the Chinese central bank, Bitcoin went on to record a then all-time high of about $1,242 just before the close of November 2013.
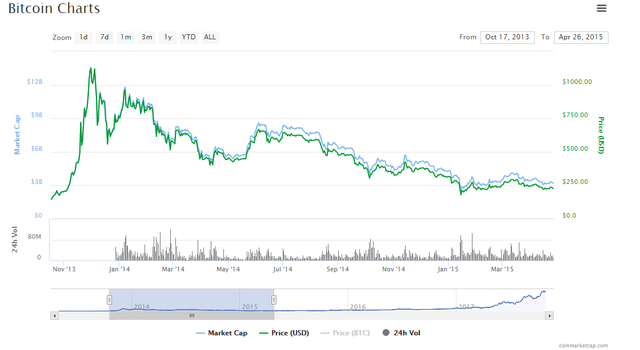
However, two major events — the struggles of the then-largest Bitcoin exchange MT Gox and the Chinese central bank banning financial institutions from using Bitcoin — started the first highly volatile Bitcoin price movement. Between Nov. 29, 2013, when Bitcoin recorded the $1,242 high, and Dec. 18, 2013, Bitcoin shed about 54.8 percent in value. Although it recouped some of the losses at the start of 2014, the digital currency reached another low of $386.20 in April 2014 — declining by 60 percent from a $958 high in January 2014. Over the next year Bitcoin would continue its downward trend to record a three-year low of under $200.
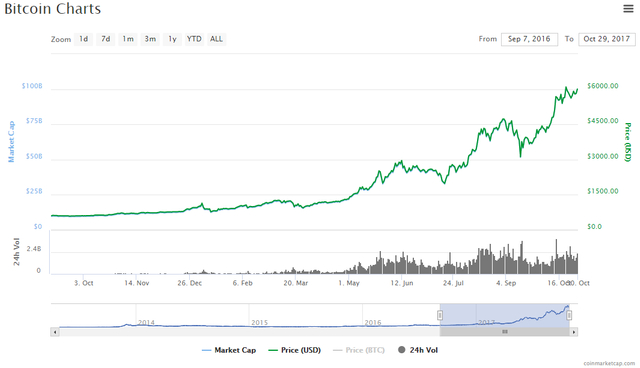
Bitcoin started rallying again in 2016, rising above 138 percent in 2016. The highest drop witnessed in 2016 was a 19 percent drop between June 19 and June 23. By the standards of previous volatility signs, it’s safe to say 2016 was quite a stable year for Bitcoin.
As of the time of writing, Bitcoin had risen by nearly 500 percent in value since Jan. 1, 2017. Despite the huge gain, the largest major drop in the price of Bitcoin was 33 percent — between Sept. 1 and Sept. 14, the period when the Chinese government cracked down on Bitcoin.
What can we infer?
The short answer is that Bitcoin’s biggest volatility moves are more intense than the dollar’s volatility moves historically. And that shouldn’t be surprising. Here’s a bit more detail.
First, the longest overall downward streak in the U.S. Dollar Index that led to the highest decline in the value of the U.S. dollar was between January 2002 and December 2004. That’s nearly three years. The index dropped by about 32.8 percent during that period.
By comparison, Bitcoin’s sharpest downward streak that led to the highest decline in price was between January 2014 and April 2014 — about three months. The digital currency lost about 60 percent of its value during that period. There was no time over the last three decades that the U.S. dollar lost so much of its value within months. In addition, Bitcoin’s longest downward streak lasted between November 2013 when it reached a high of about $1,242 and January 2015 when Bitcoin reached a low of about $192 — an 85 percent drop.
A bright spot for Bitcoin
Yes, Bitcoin has been volatile and it still is.The bright spot, however, is that stability is gradually becoming a part of Bitcoin. As mentioned earlier, the steepest decline in the price of Bitcoin in 2016 resulted in a mere 19 percent drop. In addition, the largest major drop in the price of Bitcoin so far in 2017 has been the 33 percent drop in September with the news of Chinese regulations on ICOs and cryptocurrency exchanges. This was a bigger event than in 2013 when the price of Bitcoin dropped by roughly 55 percent after the Chinese government banned financial institutions from using Bitcoin. The increased stability is mainly due to the fact that Bitcoin’s trading volume has increased considerably compared to 2013 — as shown in the Bitcoin volume chart above.
Verdict
For all the publicity of Bitcoin’s volatility, little has been said about how it’s gaining stability. As its trading volume increased over the years, elements of stability have kicked in. It’s safe to say, the more stable Bitcoin’s trading volume becomes, the more stable its price will be.