(16/03) EUR/USD Analysis and Forecast

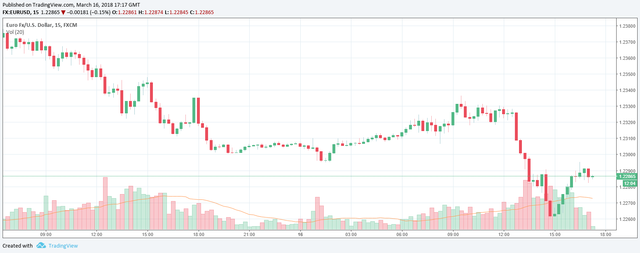
The pair traded comfortably above 1.230 before slumping.
A weekly low of roughly 1.226 was reached this afternoon.
Analysis
Following the negative trend that the major Forex pair has witnessed recently, activity in the earlier hours of today showed positive signs, as the price was ranging between 1.230 and 1.232.
After certain Economic events today, although the price movement was looking bullish momentarily, the chart above indicates that this elation was short lived, and selling began once again which drove the price down to roughly 1.226, a level which the pair hasn't seen since last week.
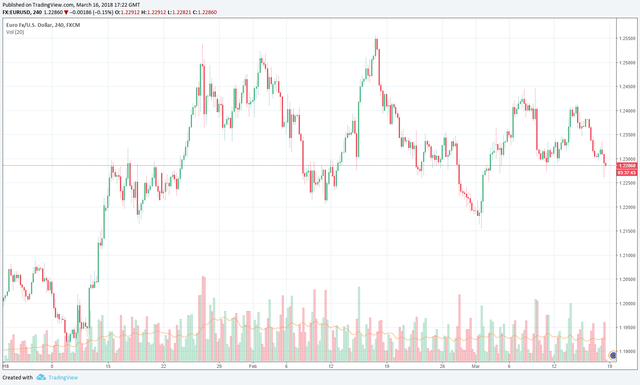
The 4 hour chart seems to be a lot more convincing, as it is known that the currency pair has improved since the start of the calendar year. This may be encouraging for long-term investors. However, movements since the start of March have indicated more of a ranging movement, between 1.225 and 1.245, with important news playing a major factor in the price uncertainty.
Forecast
Although there has been a downtrend, may technical indicators suggest that 1.226-1.23 is a new support level for the currency pair. This may indicate a gradual upward trend that can be also applied to long-term investors who hope that the EUR/USD can replicate the strong movements that we have witnessed since the start of the year.
Check out more here at Paradigm Resources!
Disclaimer: The forecast above is of my opinion and should not be used as a firm indicator to act on the market, but as an insight and thorough analysis of the general movement and trend of the currency pair discussed above.

