STEEM and BTS price action analysis (30 Oct 2017)
STEEM

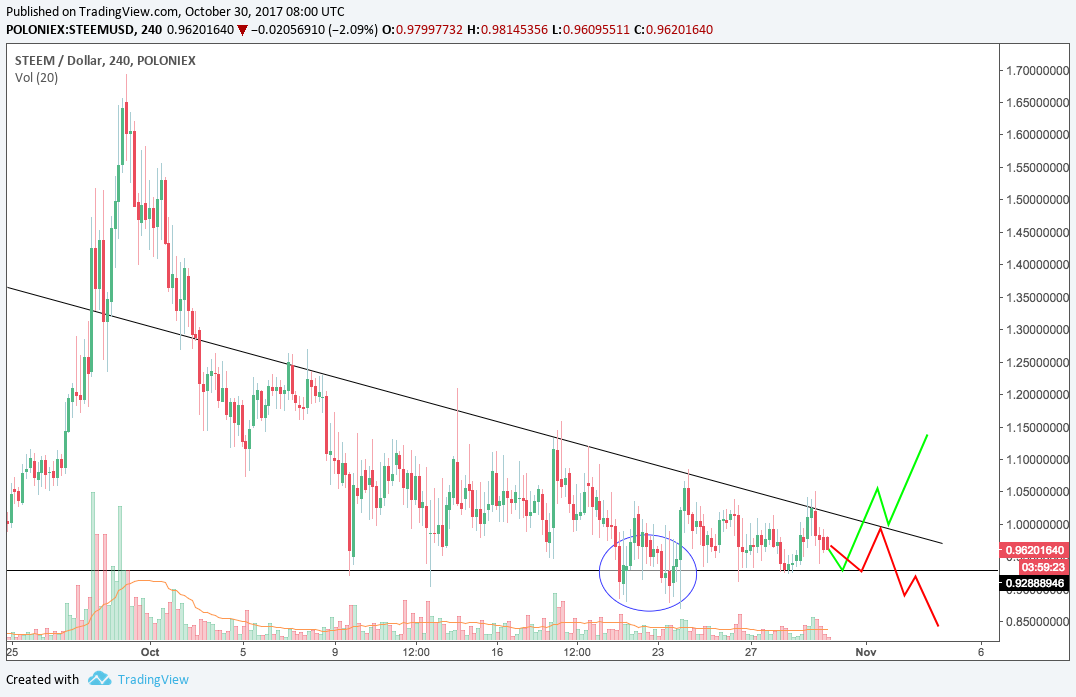
STEEM/USD 4H chart
Price moving downward from the beginning of this month, along a down-trend resistance line. And there is also a significant support line at approximately USD0.927, being tested many times within a period of more than one month. There are two false breaks into the downside of the support line, but the price gets back to the region above 0.97 immediately, adding some significance to this price level.
In the 4-hour chart, it seems that the price is heading to test the support line once again. One high probability scenario would be that the price bounces at the support line. But the width of the triangle channel is getting narrower, and the price has to break from the pattern, later or sooner. But to which direction?
For long-term investment, I think this is surely a good time to get in, or to increase your holding. But for short-term trading, it might not be a good time to set up any position, as we can see that the volatility is decreasing.
BTS
.png)
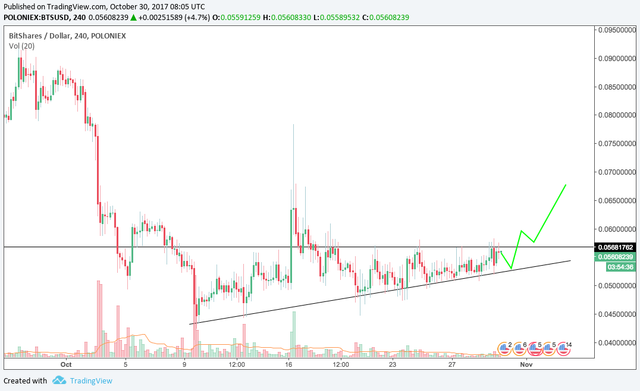
BTS/USD 4H chart
Meanwhile, seems that BTS price action is gaining some momentum.
This is a quite typical ascending triangle pattern, where price is going to break the above resistance line and heading for higher.
Or, the price will go down to test the ascending trend line below once again before breaking the upper barrier.
Either one of the scenarios, BTS is good for medium to long-term holder to get in now.
Disclaimer: All contents in this post are just a sharing of my personal thoughts, and hence should not in any way be taken as an investment recommendation.
@originalworks
The @OriginalWorks bot has determined this post by @ozy to be original material and upvoted(2%) it!
To call @OriginalWorks, simply reply to any post with @originalworks or !originalworks in your message!