Description of order book and charts
Hello Everyone,
Its Mr. Crypto India, hope you all are doing good with your crypto trading, last time we covered some important rules or we can say golden rules in crypto trading. Today i came up very interesting things on trading, very basics things but very important things while doing trading, although i am guiding people on cryptocurrencies and trading basics through a public telegram channel , so its very important to learn the basics of trading so that we can do a successful trade.
Lets begin, first i want to explain about orderbook 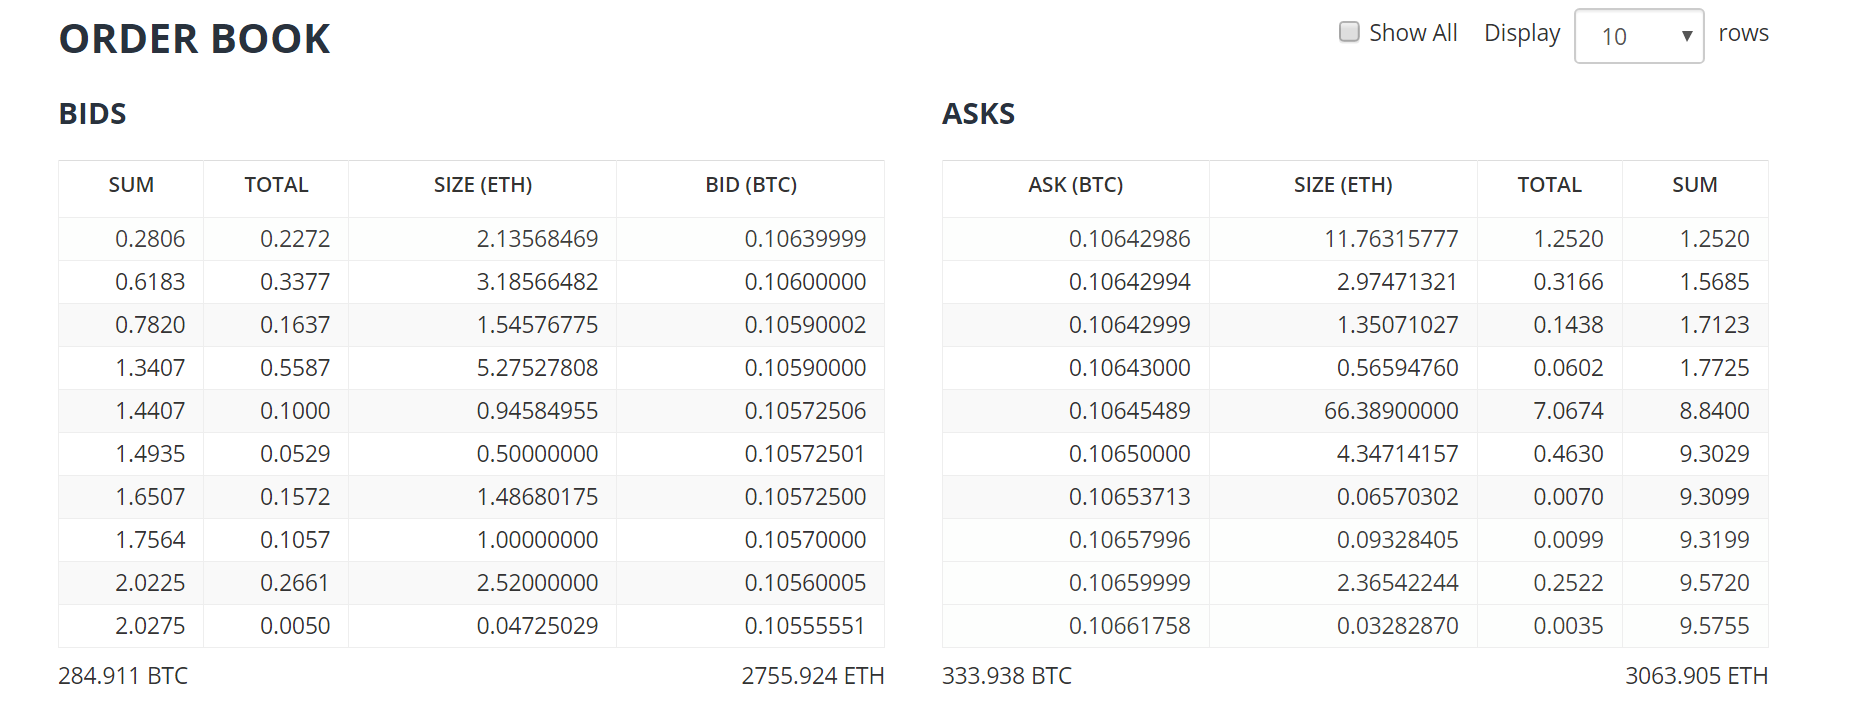
Image source : Bittrex
Its an orderbook of Ethereum, orderbook contains buyers and sellers orders, we can see at what price how much amount of buy or sell order is present so that we can decide our entry in that coin.
As we see clearly in the picture there are two columns one is Bids column and other one is Ask column, Bids column has a buy orders and Ask column has sell orders. For example at a bid of 0.10639999 satoshis(bid column) there is an buy order of 2.13568469 ETH, and at a bid of 0.106422986 satoshis(Ask column) there is a sell order of 11.76315777 ETH.
If we want to see orderbook in a graphical representation then here is the picture
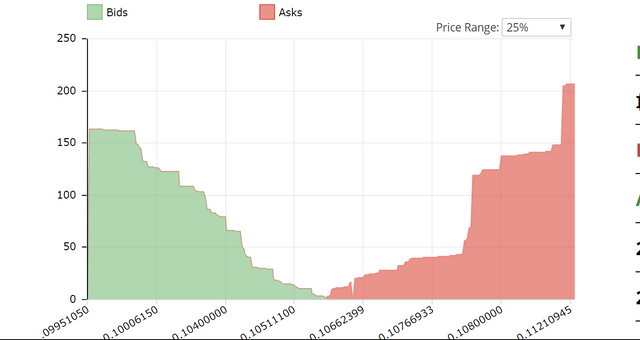
Image source : Bittrex
As we see in graphical representation of orderbook , green mountain is amount of buy orders and red mountain is amount of sell orders.
Now charts
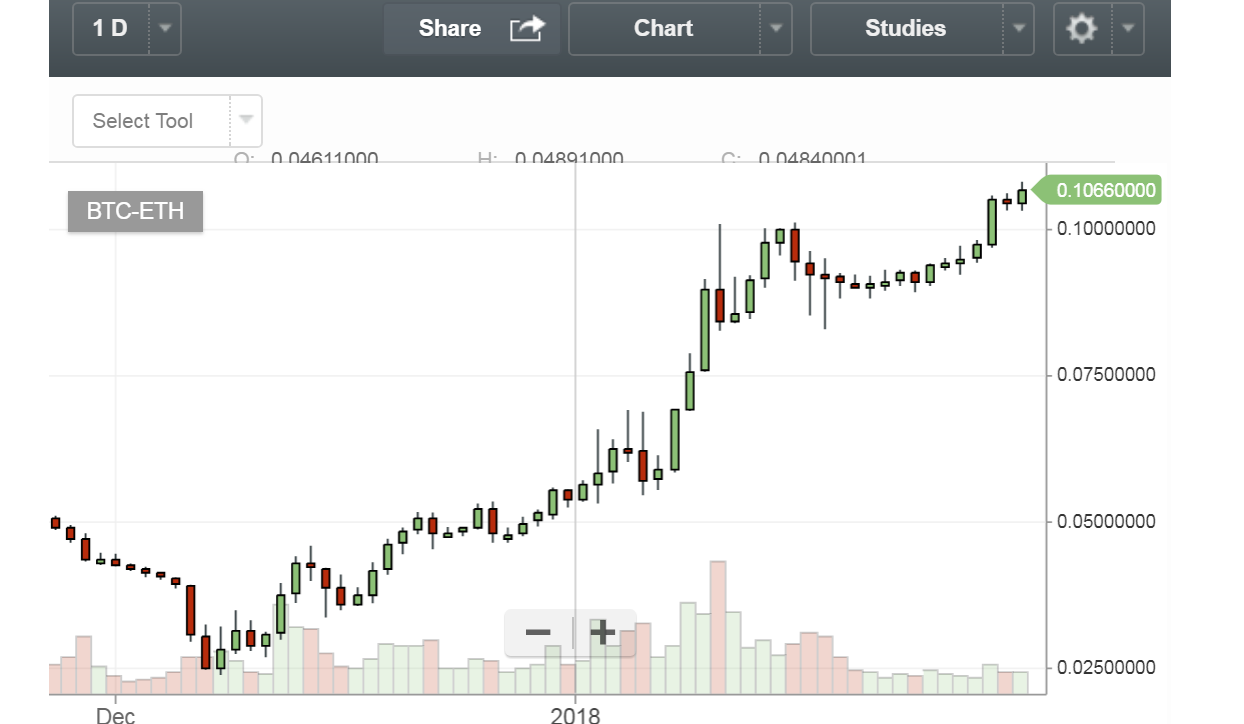
Image source : Bittrex
So talking about charts, charts are having some lines/bars going up and down, it basically represents from where price is going with respect to time, so charts are very important to see while doing trading as it gives us some indicators about bullish or bearish behaviour. In this chart green line is representing that price started from down at certain time frame and closed up showing bullish nature, and red bar shows that price started from up at certain time frame and closed down showing bearish nature.
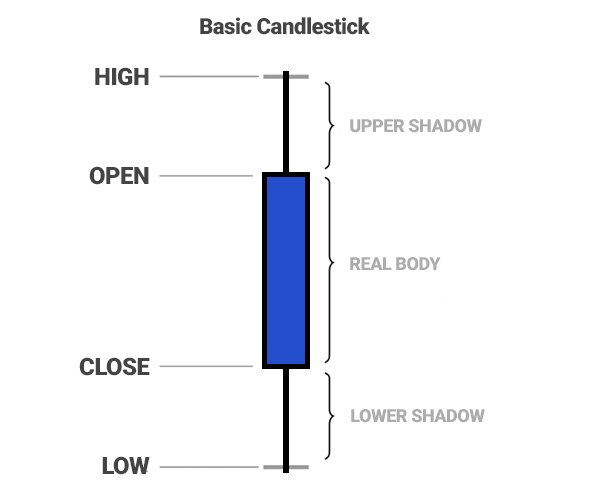
As we can see from this candle price started from open and then it went high and then dipped low and closed at x interval of time, x can be 5 min, 30min, 1 hour, 1day etc. So basically this candle contains a upper shadow, real body and lower shadow, it is closing down so its an bearish candle.
So we get to know about orderbook and charts, now the real question is why we should see orderbook and charts? What is the significance of orderbook and charts?
So let me reply you this question as from orderbook we can see what is the demand of that coin, how many buy order are there, how many sell orders are there, we can decide where to take entry in that coin by looking at orderbook and charts, from charts we get to know where is resistance and where is support, now there are two new terms support and resistance, so what are they?
Support is where buyers take over sellers,means there are more buyers at that price than sellers, so the price will not go down from support and we can safely enter at support now resistance is where sellers dominate buyers making prices go down from resistance, means more sellers are there than buyers we can decide to sell off our coin at resistance, so this is the ideal situation but often support and resistance both breaks down, when a resistance breaks then it becomes new support and when a support breaks it become new resistance.
So what causes them to break?
A huge buy at current price when breaking resistance at current price is necessary, and a huge sell at current price is necessary to break the support.
Now Market History
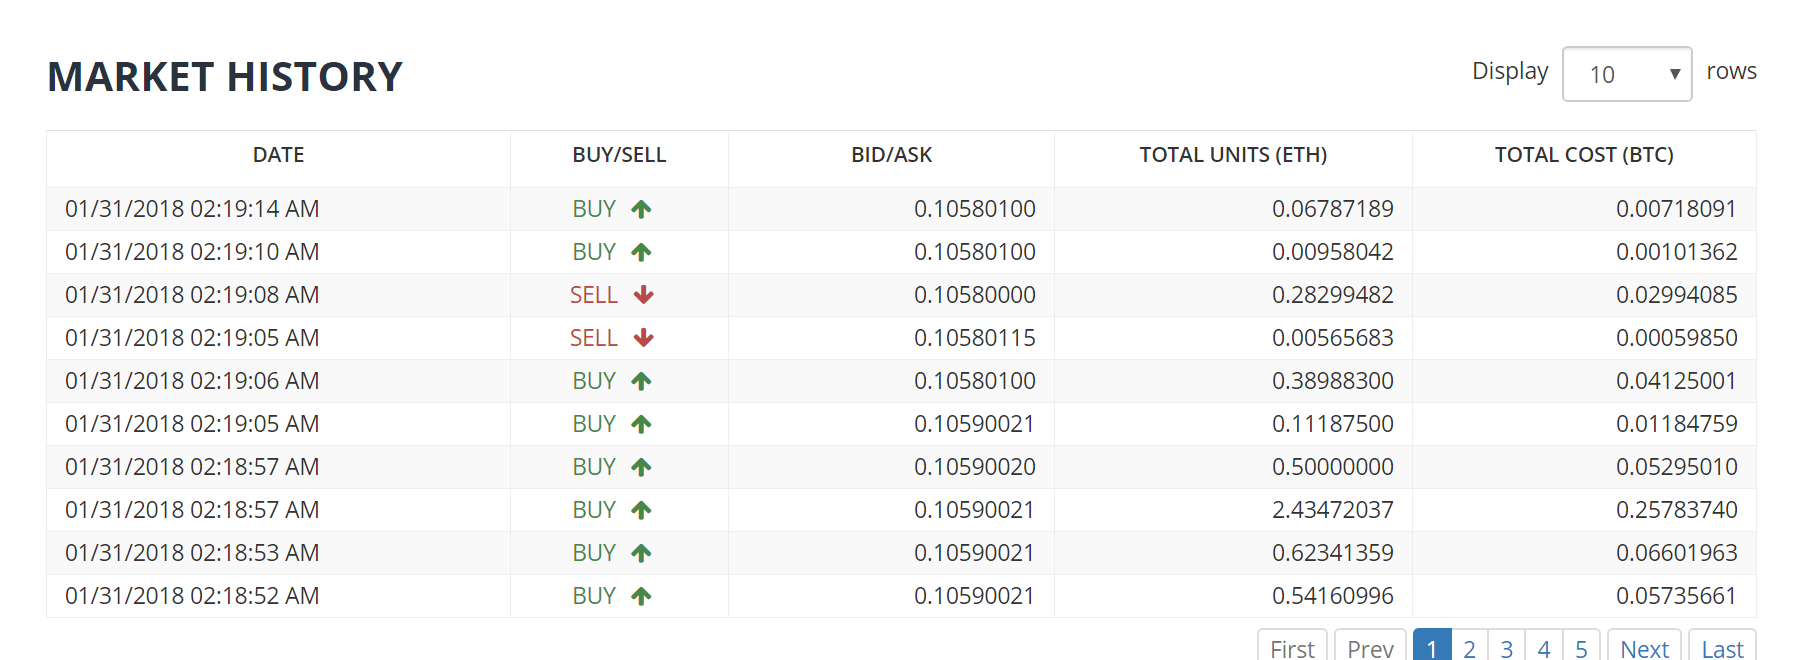
Image source : Bittrex
This is the market history where we see how much ETH is bought or sold at certain time like we can see buy in green and sell in red and it is clearly mentioned price and time at which x amount of eth is bought or sold, market history is very necessary to see to decide when to sell and when to buy.
How Prices Move?
So its very important what causes price to move, when anyone buys or sell at current price then prices move,and that is shown in market history, many people often confuse that putting a bid either in buy side or sell side causes prices to move , but its not like that market moves when someone sells or buys at current prices, smart people rarely buy at current price or sells at current price, they just put bids and wait for their order to get filled, newbies enter in the market everyday, they buy at current price and when someone buy it means someone is selling at particular price and when someone is selling than someone is buying at particular prices.
I hope you enjoyed this blog, next time we will learn how whales manipulate the prices.!
Invest in Tech, not in coins!
Cheers!
Thank You!!