Technical Analysis for Beginners - Relative Strength Index (RSI)
The Relative Strength Index (RSI) is another simple indicator that beginners can find very useful in identifying future price movements. The RSI is a measure of momentum of price action, and by default uses the gains and losses of the 14 prior periods to plot the speed of price changes.
The indicator scores the current movement from 0 to 100 using the following equation:
where RS = Average Gain / Average Loss
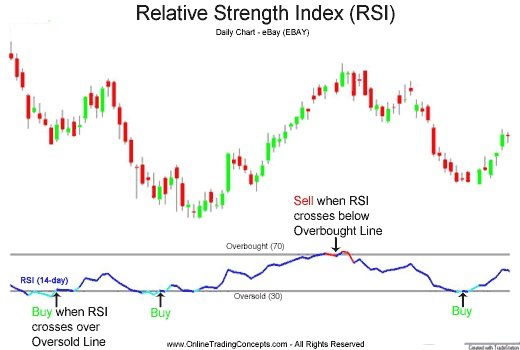
The main way the RSI is used is to indicate when the market is either oversold (score < 30) or overbought (score > 70) as these can be great times to buy or sell into the market, when a potential reversal is imminent. A period of an asset being oversold could be a good time to buy, where a period of overbuying might be the time to sell. Be careful as a large influx of volume in a short period can provide a false reading of momentum, so the RSI is more commonly used on the 1hr chart and above.
Thanks for breaking it down. I’m a fan of using the RSI.
You're very welcome. Glad it was of some help.
Looks decent guide thanks https://9blz.com/rsi-indicator-explained/