Technical Analysis for Beginners - Continuation Patterns
Chart patterns are one of the fundamentals of a Technical Analysis, but identifying them doesn't have to be that hard and can give you an excellent incite into the potential future movement of the market. In this series of articles I'll be introducing a number of patterns to look out for to get you started.
Continuation patterns are, as you might expect from the name, those that are likely to result in a continuation of the current trend. Current trend up...likely to continue up, current trend down...you get the picture.
Lets take a look at our first patterns...
Rectangles

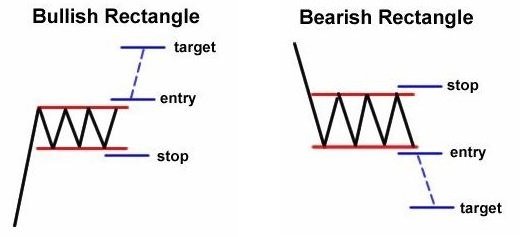
Rectangles come in two different forms, bullish and bearish, depending on if they appear on the uptrend or downtrend of a chart. The rectangle is formed as the price temporarily stalls and ricochets between the parallel resistance line and the support line. Pay close attention to when resistance or support is broken as this is the time when the overall trend is likely to continue and could be your entry point into the market.
Pennants

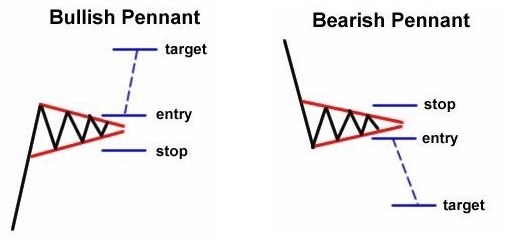
Pennants, sometimes also known as flags, generally occur during sharp up trends or down trends. It is again a stalling or pausing of the price but usually over a shorter time frame than a rectangle. The pennant is formed by a lessening difference between the resistance and the support lines, and is usually followed by another sharp movement in price once the convergent point is reached.
Wedges

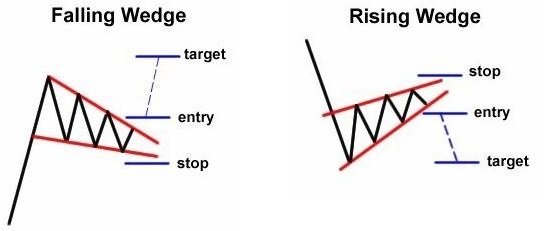
The final continuation patterns to be aware of are wedges. These are slightly more complicated as they can be both continuation or reversal patterns depending on if they appear on an up trend or a down trend. The falling wedge is an indicator of a continuation in price movement only when appearing on an upward trend. Similarly, a rising wedge is a continuation pattern only when appearing on a downward trend. As previous, watch for the point of breakout, indicating the continuation of the overall trend.
I hope this brief overview of continuation patterns gives you some simple indicators to look out for to predict future price movement. The results aren't guaranteed but these patterns will hopefully form the start of most technical analysis'.
Thank you for the decent guide https://9blz.com/rising-wedge-pattern/