Technical Analysis for Beginners - Bollinger Bands
Bollinger bands are a widely used analysis tool comprised of a moving average centreline, flanked by the upper and lower bands of the calculated standard deviation.
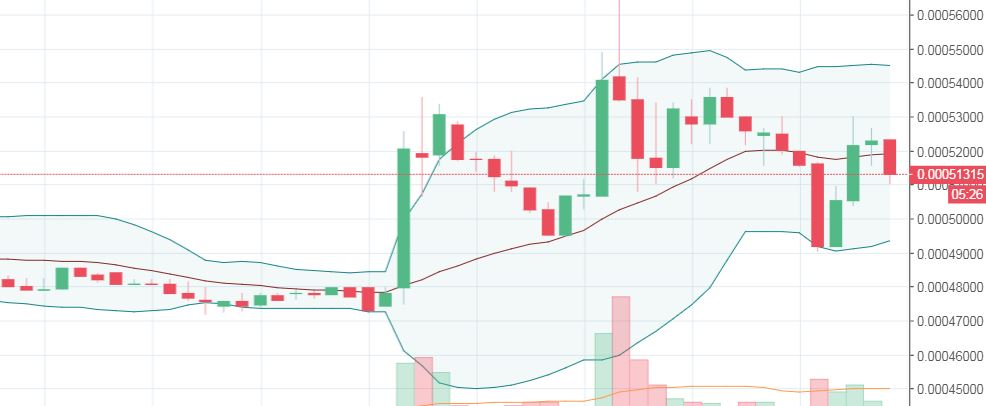
The above graph is a snapshot from today's price action of STEEM/BTC and perfectly demonstrates the various ways to use the Bollinger Bands. Because in statistics, standard deviation is a measure of volatility or fluctuation, the bands narrow with a relatively flat or stalled period of sideways motion. Periods like this can often be followed by a break up or down of the price, as seen below, so can be something key to look out for. Combining Bollinger Bands with other technical analysis techniques can give you a better idea of the direction of the impending breakout.
During a period of high volatility, signified by wide bands, the price action can often be seen to rebound between the centreline and the upper band, or the centreline and the lower band. Any extension of the price above or below the bands is a clear indication of an asset being over or under sold.
This gives us key points to buy or sell. If the price is rebounding above the centreline we would buy as the centreline is hit and sell as the upper band is realised. The opposite would be said if the movement was in the lower half of the Bollinger Bands, buying as the price hit the lower band and selling as the price hits the centreline.