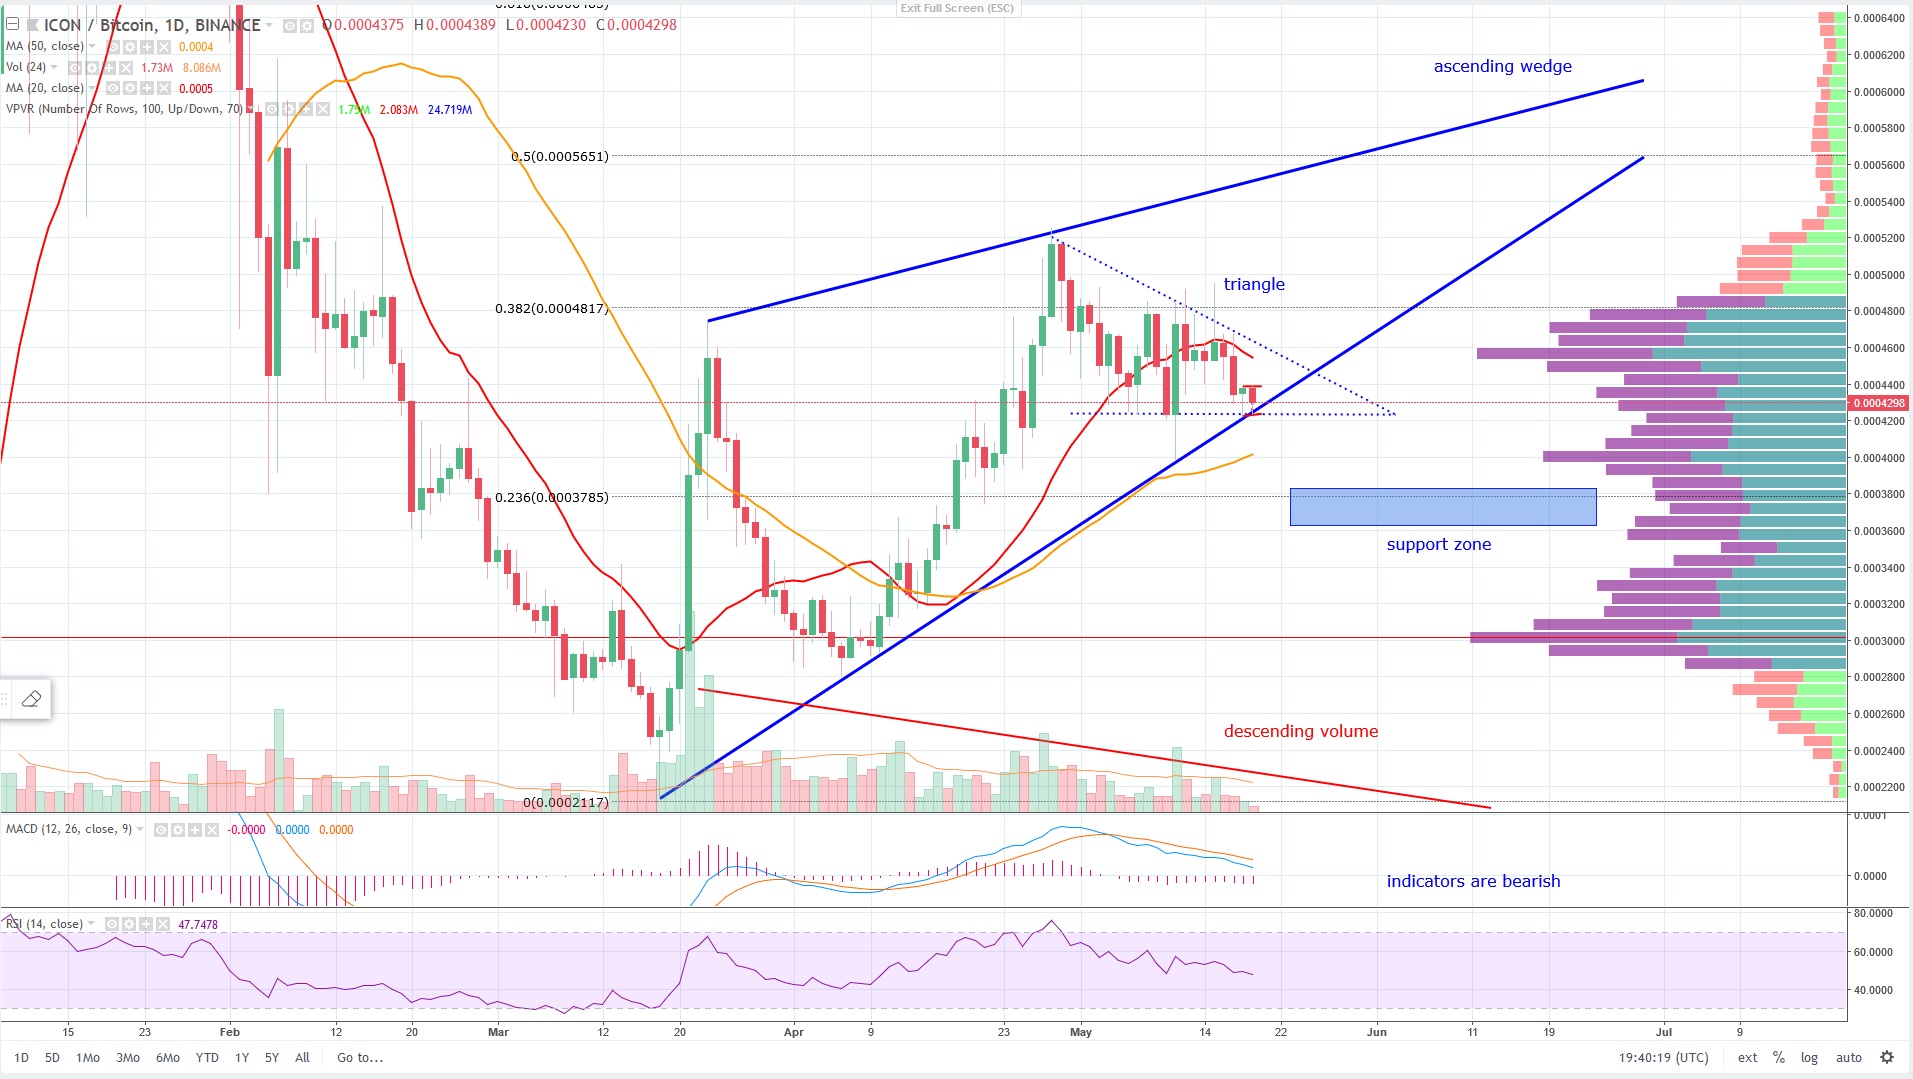
ICON - ascending wedge
Hi my friends, here is ICON analysis.

- ascending wedge is bearish pattern
- waiting for candle close above or below dotted trend line
- when close close above dotted trend line, next resistance is 0.382 fib = 0.0004800
- volume is descending
- all technical indicators are bearish
I think, the bottom dotted trend line and blue trend line will break.
Majkee
What wouldn't happen, I think that ICON - very perspective project
Yes, I agree, ICON is very good project. This is technical analysis, not fundamental.
You have a minor misspelling in the following sentence:
It should be resistance instead of resistence.You got a 3.40% upvote from @emperorofnaps courtesy of @majkee!
Want to promote your posts too? Send 0.05+ SBD or STEEM to @emperorofnaps to receive a share of a full upvote every 2.4 hours...Then go relax and take a nap!
icon to the moon
I hope :)