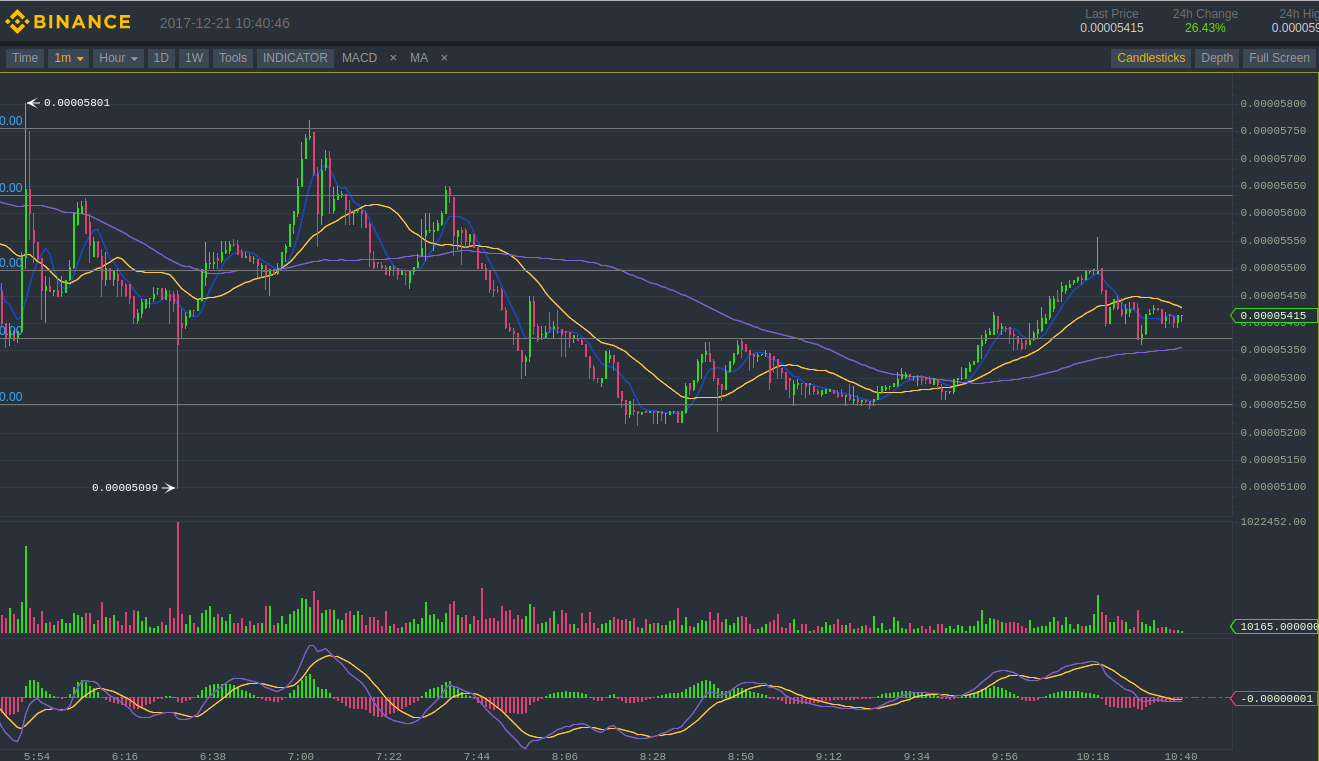
XRPBTC Support and Resistance lines
TL; DR
Lazyfrog attempted at identifying support and resistance lines for Ripple-btc (XRP/BTC) market. He would like some opinion and advise from some of the experts in the community. The chart he created is below. The interval is 1 minute. The reason I chose this is because the market is quite volatile and it changes quite often.
The white horizontal lines are supposed to be the support and resistance lines. Any advise and comments are welcome.
Learning Technical Analysis
LazyFrog has been attempting to learn technical analysis for trading. He played with different techniques so far. The success has been mixed. Recently lazyfrog put some minor amount in Ripple (XRP) and made some moderate profits. Though this morning when he woke up, he realized that he could have made more. Predicting how super volatile cryptocurrency trading is going to behave is impossible but LazyFrog is trying to learn from his previous mistakes. Since the steem community has many experts and friendly people, he thought what better place to sought feedback than steemit.
