Chainlink (LINK/BTC) + BTC/ETH/LTC Technical Analysis!
Youtube:
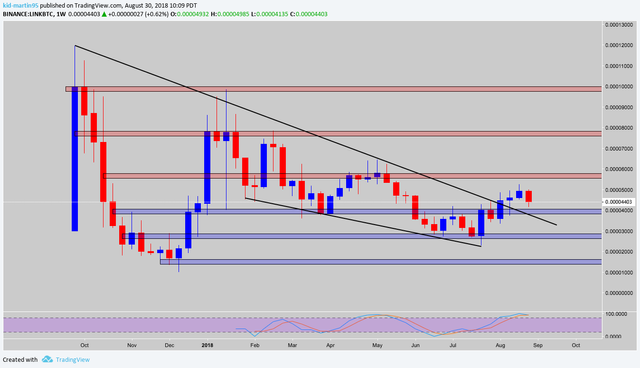
Weekly
Looking at our trend timeframe we see price has recently broke out of its descending wedge pattern, stochastic rsi showing momentum was in favor of bulls currently at a temporary pause. LINK has found resistance at 5000, expecting a retracement towards 4200. Will be watching smaller timeframes for entries.
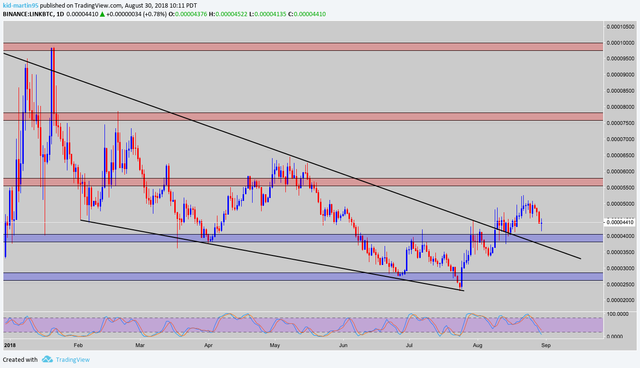
Daily
Shifting over to our pattern timeframe we see LINK has broke out of its descending wedge pattern, and is now looking to retest our horizontal and dynamic support at 4000. Stochastic RSI showing momentum in favor of bears with no signs of reversal. A daily close above 5000 activates our trade, however if rejected at this level expect a sell off towards 3000.
Conclusion
- Buy: After Daily Close Above 5000 / Bounce Off 3000
- Sell: NOOO

Comment Down below what coin you want me to do next! ;)
Thank You for Your Support, Upvote and Follow!!! New Blog and Video everyday
Social Media:
Twitter
Instagram
InvestFeed
Tradingview
Crypto Trading W/ Leverage
How to Draw Trend-lines & Identify Trends
How to Draw Support/Resistance, Price Only
Disclaimer: I am not a financial advisor nor am I giving financial advice. I am sharing my biased opinion based off speculation. You should not take my opinion as financial advice. You should always do your research before making any investment. You should also understand the risks of investing. This is all speculative based investing.
▶️ DTube
▶️ IPFS
You write well, @kidmartin-95!