BTC Update 04/11/2018
Evening all, tonight i thought id do a quick update on BTC's price action as we actually saw some movement.
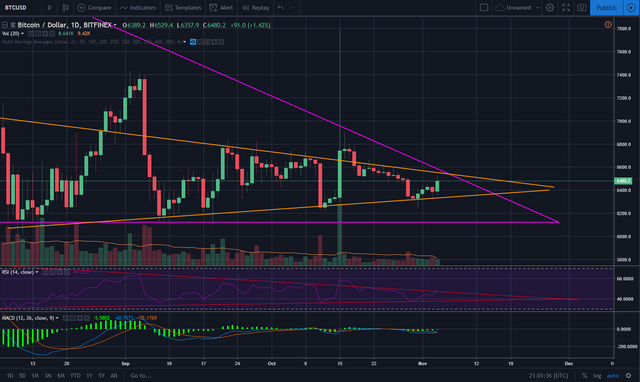
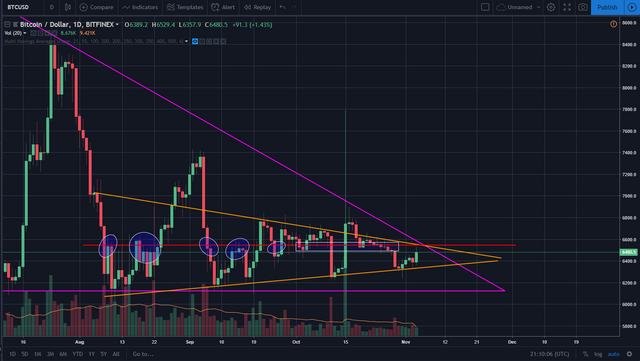
From the screenshot below you can see that the symmetrical triangle pattern, which i have been talking about in the past two blogs, is still playing out. From the MACD i see that the histogram as actually ticked upwards towards a more neutral point which could mean that some positive price action could be around the corner, if that is the case, there is a WHOLE load of resistance at $6550.

If you look you can see what i mean by the massive amount of resistance BTC will face at around $6550, first of all you have the descending triangle which is the purple line running down towards the apex, then you have the resistance of the upper resistance line of the symmetrical triangle, then you have the horizontal resistance of previous price history. Keep that in mind if you are going to trade a long play. For me BTC is in a no trade zone, im not trading until we see a clear decisive break and a set in trend.
Thankyou for taking the time to read this blog. Let me know your thoughts on where BTC is heading in the next month and going into early 2019. Upvotes and follows are very much appreciated!
==============================================================
Disclaimer: I am not a financial advisor and any of my content should not be taken as financial advice. The information and content provided is purely my own thoughts and intended for informational and entertainment purposes only. This is not investment advice. If you want to invest you should consider consulting with a professional beforehand.