BTC 28/10/2018
Good evening, today ill be giving my updated thoughts on BTC's latest price action and a pattern i see.
Bitcoin has officially been the least volatile its ever been, quite remarkable considering the vast daily price action we was seeing at the end of 2017. Do not fear, that volatility will return.
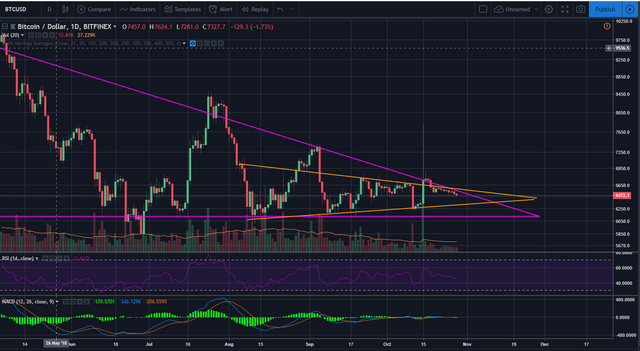
I just wanted to talk about a pattern which i see forming towards the end of this descending triangle which i find quite interesting. As you can see below i have marked out a orange symmetrical triangle with the top of the triangle being used as resistance for price action. To me this is very interesting, because with it being a descending triangle on a longer time frame, BTC has yet to come back down to test $6,000 since the beginning of September, and the price has been lurking around this upper resistance of the triangle for a while. Although, unless we see some bullish momentum i do not see us breaking this resistance, volume has been declining and it is getting thinner and thinner. Keep your eyes peeled on BTC. If you are trading, remember to set Stop Losses.
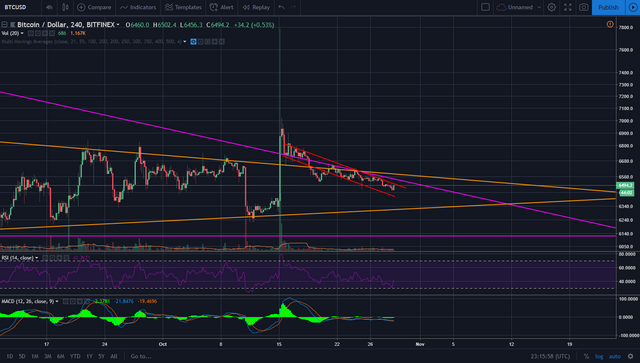
One more potential pattern which could be playing out is a bull flag.

Let me know where you think BTC is going to be this time next week, will we see a big month in the next few days, weeks or months? Upvotes and follows are greatly appreciated.
==============================================================
Disclaimer: I am not a financial advisor and any of my content should not be taken as financial advice. The information and content provided is purely my own thoughts and intended for informational and entertainment purposes only. This is not investment advice. If you want to invest you should consider consulting with a professional beforehand.