Nubits (NBT): Pump & Dump Explained 4 Beginners (200% Potential)
PUMP & DUMP will be explained in the comments.
Indicators (Why I believe this coin is going up)
The indicators are tools that give you signals about price movement for a coin.
– Nubits has been having positive action for the past 5-7 days. A “breakout”, meaning, strong break from a certain trend. This coin just had a breakout upwards.
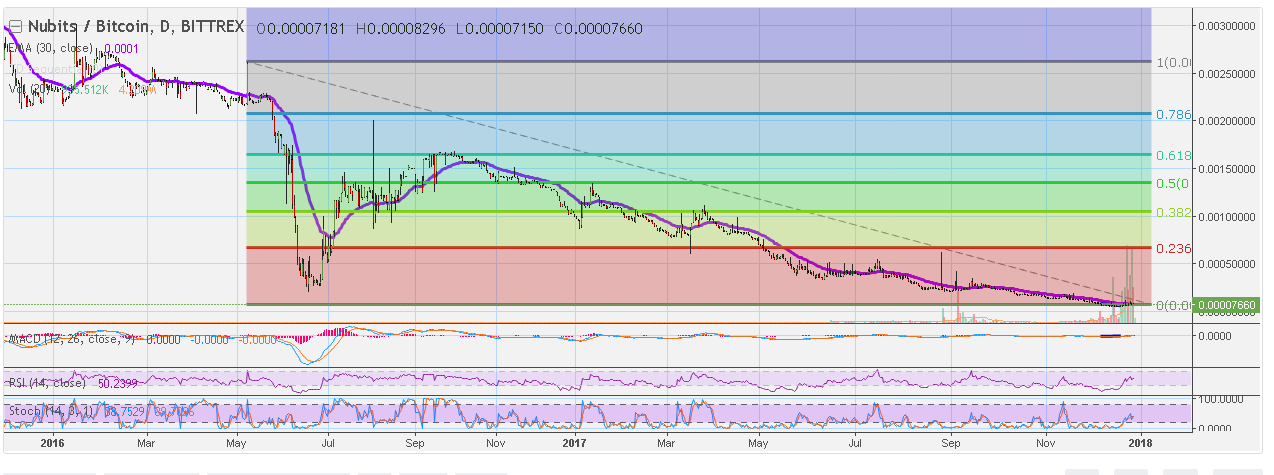
– MACD is showing positive divergence and MASSIVE room for growth.
– RSI & STOCH are pointing upwards on the daily chart . On the Weekly chart, they sitting at the super bottom, massive room for growth.
– On the same graph above, you can see a purple line, this is the EMA30. This indicator is also giving a very strong bullish signal. This is the exponential moving average price and it is sitting above the actual price. Meaning, the average price for the last 30 days is way higher than the price we are seeing today. It needs to balance…
– There are more indicators. But we don’t need to look at them, these are enough.
Notes:
– Previous All Time High 0.00504043.
– Please allow this trade some time to correct or do whatever it needs to do before take off.
– Allow this trade several weeks to develop. This is not a minutes trade, it takes days, weeks and even months for all targets to be completed.
Instructions:
Buy-in: 6600 – 8190
Stop-loss: 6422
Nubits NBT Targets:
(1) 0.00013825
(2) 0.00067405
(3) 0.00104671
(4) 0.00134790
No more targets are needed because we are supposed to face huge resistance my market manipulators. Again, I would like to see how the natural flow of a coin vs manipulators develop. This is a risky trade.