Down But Not Out: Bitcoin Remains on Hunt for $10K

Bitcoin (BTC) is reporting losses today, having failed to beat the key moving average resistance on Monday, however, the technical charts continue to favor a rally to $10,000.
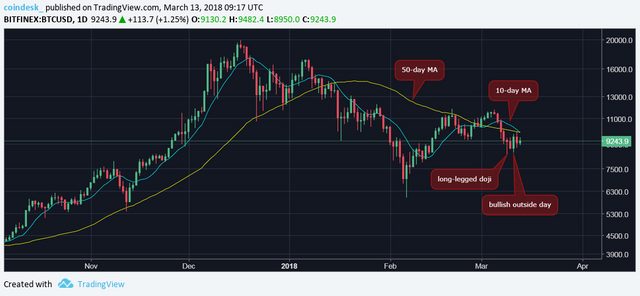
Bitcoin ran into bids in early European hours yesterday, rising to a four-day high of $9,885, adding credence to Sunday's bullish "outside day" candle. Further, BTC also witnessed a bull flag breakout (a bullish continuation pattern) on the hourly chart.
However, the bulls ran out of steam near the 50-day moving average (MA) resistance of $9,920 in the early U.S. hours.
As of writing, bitcoin is trading at $9,297, according to CoinDesk's Bitcoin Price Index (BPI). The cryptocurrency has depreciated by 4.59 percent in the last 24 hours, as per data source CoinMarketCap.
Daily chart

BTC's retreat from the high of $9,900 to $8,770 (prices as per Bitfinex) poured cold water on the optimism generated by the Sunday's bullish outside day candle and the bullish triangle breakout.
Further, it also established the 50-day MA as a strong resistance (seen today at $9,888). BTC alsoclosed yesterday (as per UTC) below the Feb. 25 low of $9,280, marking a failure to hold above the double top neckline.
The momentum studies show bear bias too. The 10-day moving average is sloping downwards, and there's a bearish crossover between the 10-day MA and the 50-day MA. So, it appears the odds are stacked against a move above $10,000.
That said, BTC is still trading well above the long-legged doji candle low of $8,342 set on March 9. The candlestick pattern represents bearish exhaustion.
So, it seems safe to say the odds of a corrective rally are above 50 percent, as long as BTC stays above $8,342.
1-hour chart

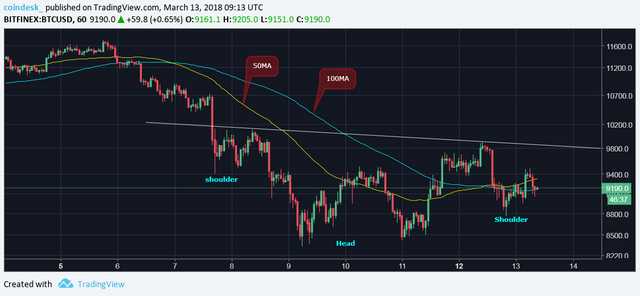
The hourly chart below shows a bullish 50-MA and 100-MA crossover.
Hence, the cryptocurrency could visit the inverse head-and-shoulders pattern neckline resistance seen around $9,850. An upside break would open doors for $11,000 (target as per the measured height method).
View
The 4-hour chart favors a rally to $9,850 (inverse head-and-shoulders neckline). An upside break would allow a rally to $10,417 (61.8 percent Fibonacci retracement of the sell-off from the March 5 high of $11,700). A violation there would expose resistance at $11,000 (inverse head-and-shoulders breakout target).
However, the sustainability of gains is under question as the weekly chart shows the relative strength index (RSI) has rolled over in favor of the bears. Thus, only a weekly close above $11,700 would confirm a long-term bearish-to-bullish trend change.
On the downside, a move below $8,770 (previous day's low) could yield a re-test of $8,428 (Sunday's low).
Only a daily close (as per UTC) below $8,342 (long-legged doji candle low of March 3) would add credence to the bearish weekly RSI and open doors for a sustained drop to $6,000 (February low) and $5,400 (Nov. 12 low).