Charting The Top 10 - Episode #7 - Monday Bounce
Monday Bounce Back
The dip we saw yesterday was a brief one as expected, and today we've seen gains across the top 10 once again.
A few coins still look a little bearish, so let's take a fresh look at the 4 hour charts to see see what they are telling us.
Bitcoin
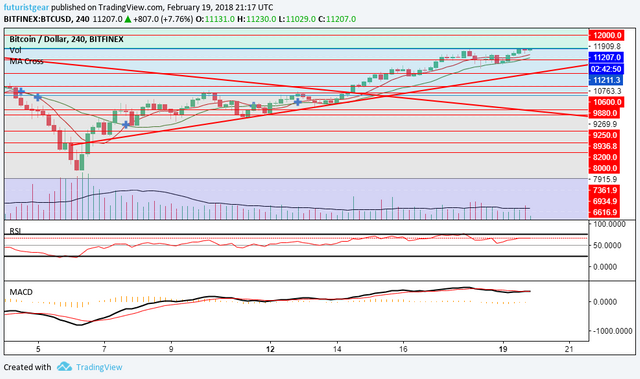
Bitcoin is back up to the $11,200 level, but it is currently struggling to break through it. If it can, then the next key level of resistance is found at $12,000.
The RSI remains strong, and the MACD looks to be turning bullish again too, so I think it could be broken soon.
If not? Look for the the $10,600 and $9900(ish) levels to hold, and also for a bounce off the short term trend line.
Ethereum
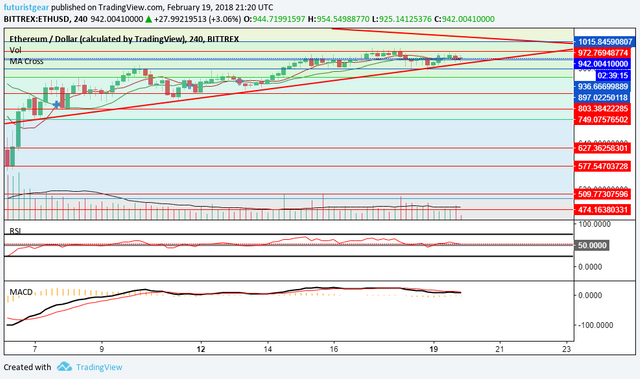
Ethereum is also facing resistance, but at the $972 figure. The RSI is a little weaker here, and the MACD is borderline bearish too, but the price hasn't fallen below the $942 level for too long, and the short term uptrend remains intact.
ETH is also approaching its downtrend line, but if it is going to break through it, we're going to need to see some more strength on the RSI and also an uptick in volume. There is also one final area of resistance before that at about $1015.
If it remains neutral to bearish, look for the uptrend line to hold, and below that the $936 and $897 support zones.
Ripple
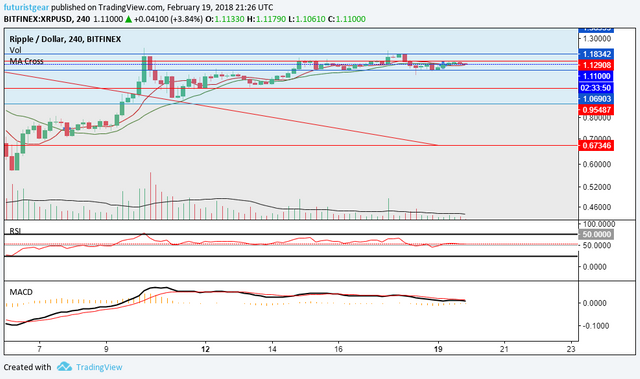
The picture being painted by the XRP chart is very similar to ETH, but it's slightly stronger on the RSI.
More volume is needed here in order to get the price out of the current range between $1.18 and $1.06.
Bitcoin Cash
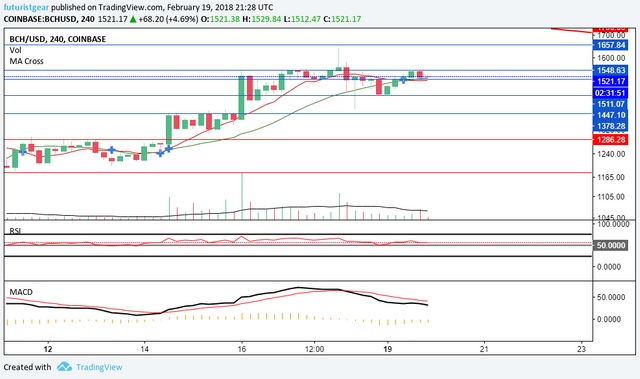
BCH has been struggling to break the $1550 level, and a couple of the indicators here are flashing sell signals currently. The MACD is clearly on the bears side, and the MA Cross has also given a sell signal too. That said, the RSI remains above he 50 level and the $1510 support figure is currently still holding.
It looks a little bearish here, so a test of the $1450 level could be coming. If the bulls take back control, and it can break that $1550 level, then the next major resistance zone is at $1650.
Litecoin
https://www.tradingview.com/x/q6RrTq6w/
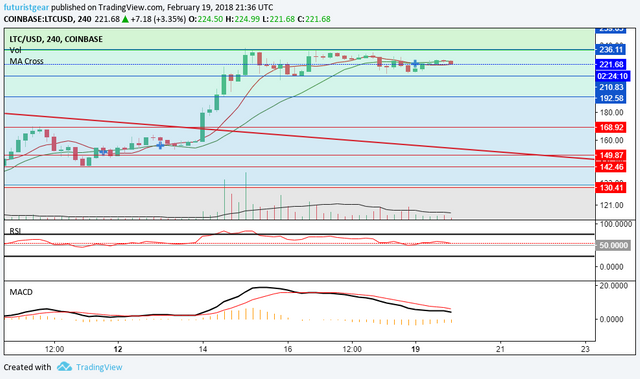
Litecoin still looks a little bearish on the 4 hour timeframe, and a test of the $210 level could happen if it stays that way, with things looking pretty similar to BCH right now.
If $210 fails to hold, the next support level is $192. Resistance is ahead @ $236 and $260 levels.
Cardano
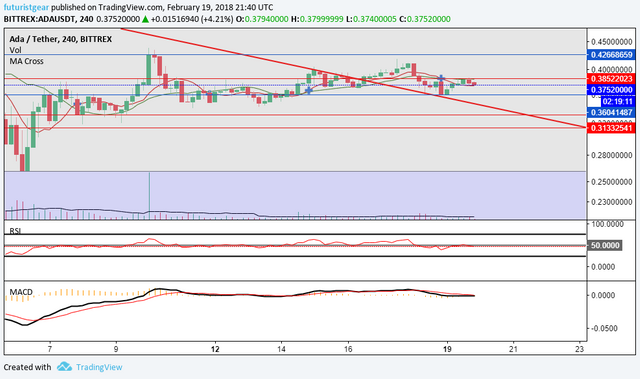
ADA is looking extremely neutral right now, with the RSI just below the 50 level, and the MACD being indistinguishable as either bullish or bearish.
Cardano needs volume and some more strength in order to break 38c level, and beyond that there is further pressure at $0.42c.
Support is at $0.36 and also the downtrend line which has used once to its advantage recently.
Stellar
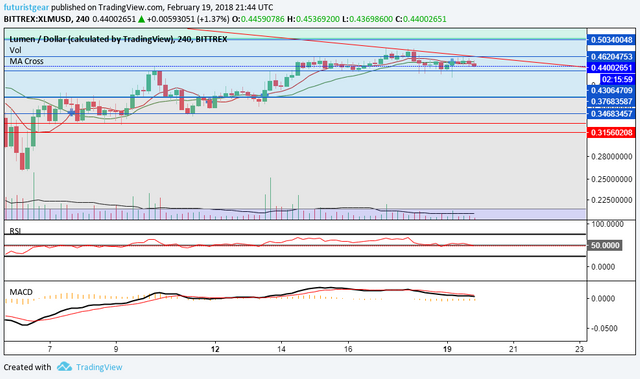
Stellar continues to face pressure from its downtrend line and it hasn't managed to break through it yet, but it is holding above the 43c level despite still looking a touch bearish on the 4 hour chart.
If it remains bearish, the next key level of support is at about 37. If the signs turn bullish once more, the downtrend line the 46c and the 50c resistance level could all finally be breached. We'll need to see more strength and an uptick in volume for that to happen...
NEO
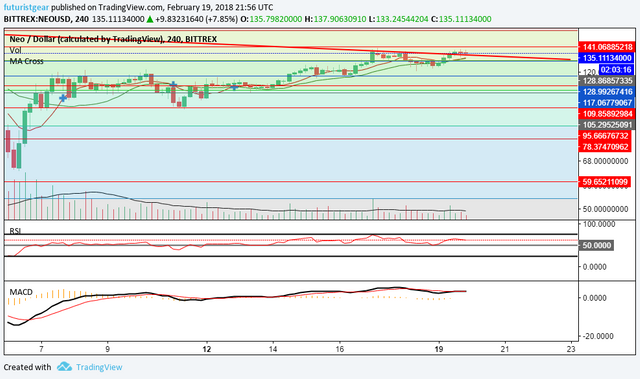
NEO has broken its downtrend line on the 4 hour chart, and it has managed to close above it twice now, which is always a positive sign.
The RSI remains strong and the MACD is neutral so it could be a little while longer before the $141 resistance level get breached.
Should things turn bearish, look for the $135 and $128 level for support if it drops back below the trendline.
EOS
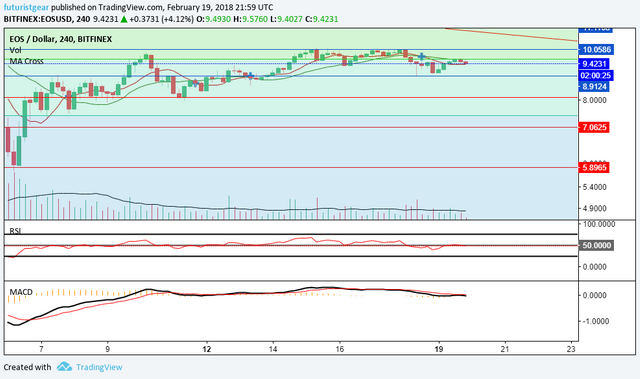
EOS looks fairly similar to EOS, BCH and LTC, and remains fairly neutral. The price is holding between the $10 and $9 levels currently, but if it turn bearish, the $8 level could come into play too.
If the bulls get their act together, the $10 level could finally broken and the next area of resistance is then at the downtrend line.
Lastly...
IOTA
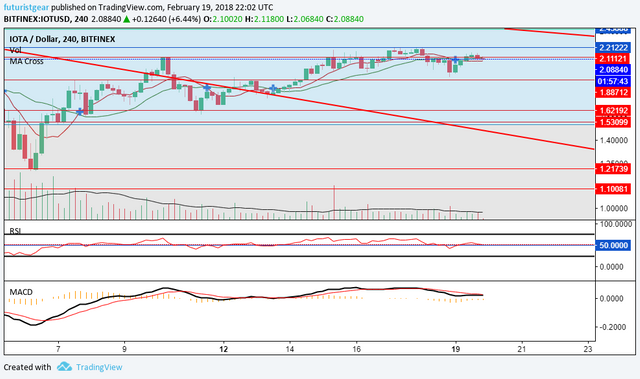
The short term story is near identical here too, with signs all point neutral. IOTA faces resistance at $2.20 if the bulls can gain momentum, but if the bears take charge the main support is found @ $1.88
Summary
With the exception of NEO and also BTC (to a lesser extent), the 4 hour charts are pretty much neutral across all of the top 10 right now despite the bounce from the lows of the Sunday dip.
There is a long weekend in play in a few countries today, so perhaps the activity will return to the market tomorrow? We'll have to wait and see!
Any thoughts, questions, or interesting analysis posts I might have missed? Feel free to leave them below!
Thanks for viewing!
Want more technical analysis and crypto related posts? See also: @toofasteddie, @gazur, @ew-and-patterns, @pawsdog, @cryptomagic, @exxodus, @beiker, @lordoftruth, @masterthematrix, @cryptoheads, @tombort, @maarnio, @steemaze & @briggsy
Not intended as investment, financial, or trading advice. For entertainment purposes only.
i'm worried with cardano.. free falling with no "live" signs, .... time to buy? hehe
I don't know for sure :-) maybe it's just waiting for some positive news perhaps? Seems very boring the ADA/USD market right now though that's for sure!
I think Bitcoin will go down for a while to complete a inverted head and shoulders pattern, for more click here @!
Nice post Upvoted as always!
Will check it out! A reverse H&S pattern would be a great confirmation of a more bullish cycle coming, so will keep an eye on that.
Thank you kindly @tombort! Appreciate it. :-D