[TA] Ethereum – is the bear market over?
original post can be found on my blog http://crocotrading.com/cryptocurrencies/ta-ethereum-is-the-bear-market-over/
Since january 2018, Ether, the crypto-fuel of the ethereum blockchain, has entered a bear market following one of the most exciting bubble in the history of cryptocurrencies. 8 months later and after a drop of more than 85%, I have good reasons to think that the price reach interesting buy-and-hold levels.
Demand zones
Let's begin this technical analysis by analyzing the long term demand zones and see whether or not buyers of ETH or Ethers are interested by those zones.
to learn more about supply and demand zones, there are plenty of youtube videos that explain how to find them.
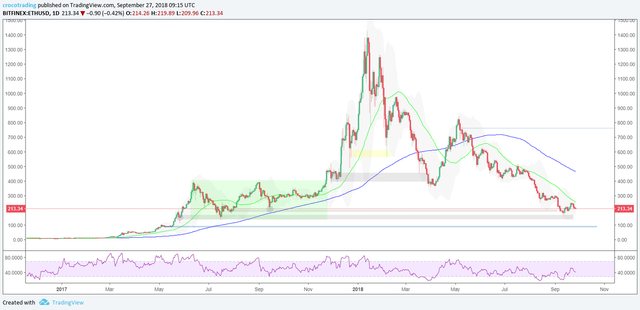
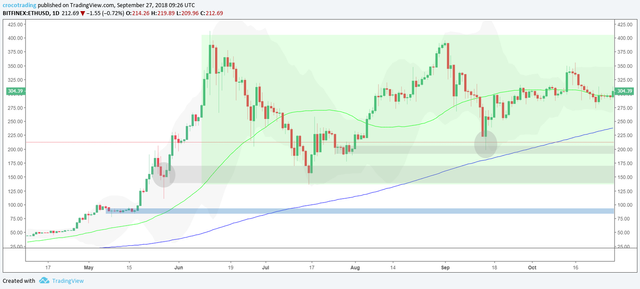
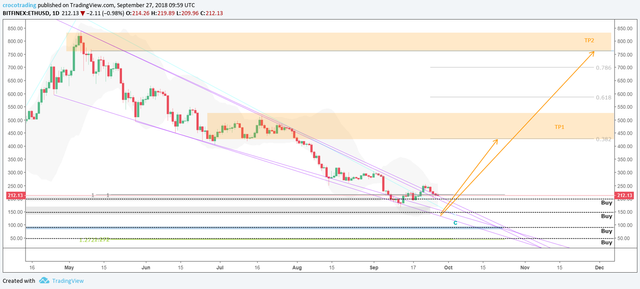
The major demand zones I have found are defined by the grey rectangles, the blue rectangle which looks like a line but is around $90 and the yellow rectangle. In the past, price has strongly bounced on both the yellow zone and the first grey zone (at around $400). As you can see, price has now arrived to new demand zones. It's the first sign that we can expect some kind of reaction on the price level.
The two pictures below show precisely how the zones are drawn. It will be too long to explain the whole supply and demand zones theory but to find demand zones, you have to spot big green candlesticks at the origin of a new upside move then see if there is a small sideway move of a few candlesticks before the strong green candlesticks. The demand zone will usually start from the lowest wick of the sideways candlesticks to the highest body of the sideway candlesticks. The more a demand zone has been revisited, the weaker it becomes.
Price action with Elliott waves
My favorite tool when it comes to long term price action analysis is definitely elliott wave theory.
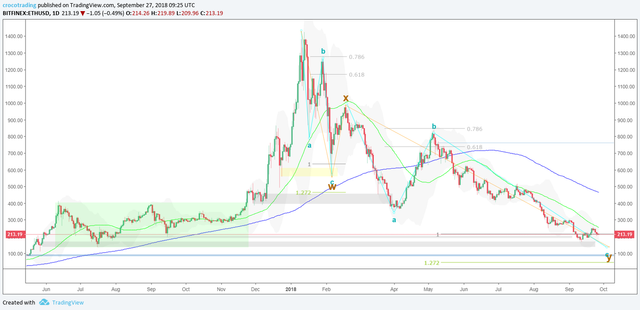
Since the all-time high, it seems like Ether has entered in a WXY correction pattern. The first ABC from around $1400 to around $600 was made in a few weeks. We might have expected a new bullish trend from there but the market decided to make a new ABC forming a double zig zag correction WXY.
The first ABC was pretty clean with wave C being almost 100% of wave A and wave B retracing between 0.618 and 0.786 of wave A.
For the second ABC, we also have a really clean wave A and B. With the wave B retracing almost exactly the same percentage of wave A than the wave B of the first ABC (or wave W).
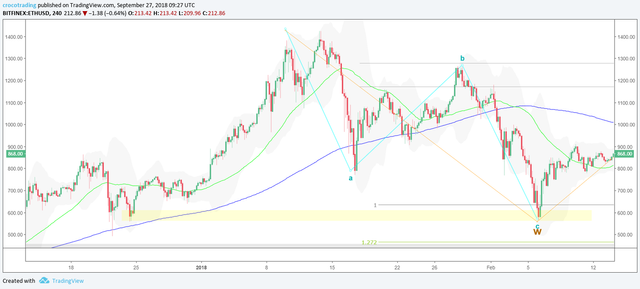
If the elliott waves count is correct, ether price would therefore be right now approaching the end of wave C (which starts at around $800 on the chart where there is a "B" written in teal). Wave C has reached a 100% extension of wave A (as in the first ABC or W).
The hard part is now to figure out where the current wave C will exactly end.
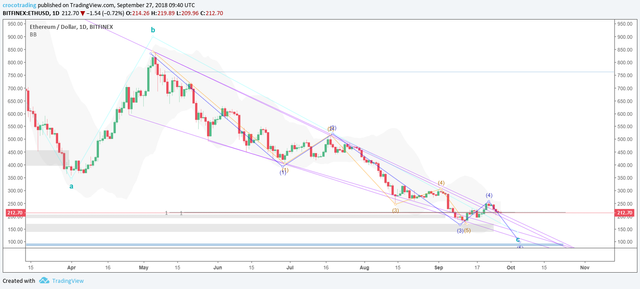
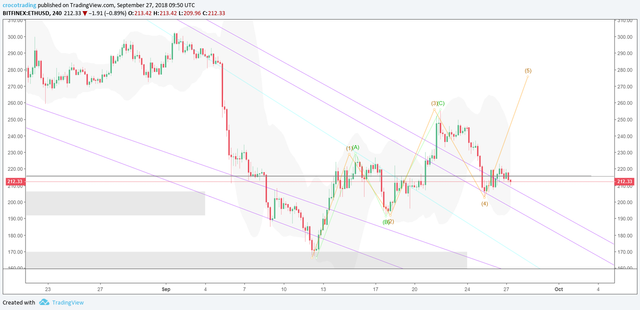
In my opinion, the wave C has the shape of an ending diagonal (which is a term used in the elliott wave theory and is also known as a falling wedge). You can clearly see that the price has been contained between two lines forming a falling wedge (see the purple lines on the chart below).
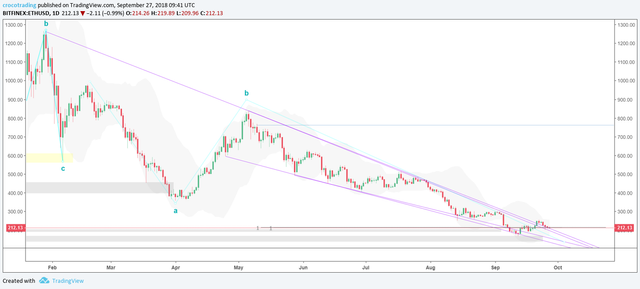
It's difficult to know exactly how to draw the purple lines which define the ending diagonale. It is a matter of one's interpretation which makes it harder to have the exact subwaves count for the ending diagonal.
I have specified the two possible counts I see in the picture below.
Before going further, I would like to remind you that an ending diagonale has 5 subwaves which subdivides into ABC patterns see https://ewminteractive.com/ending-diagonal-what-is-this for more information
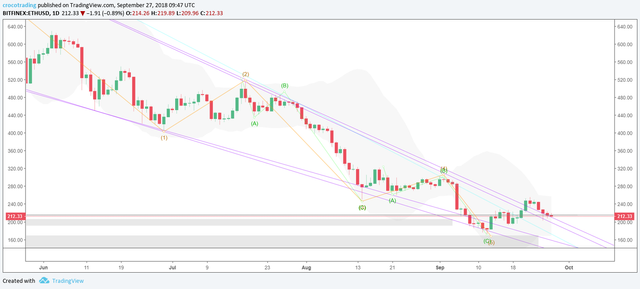
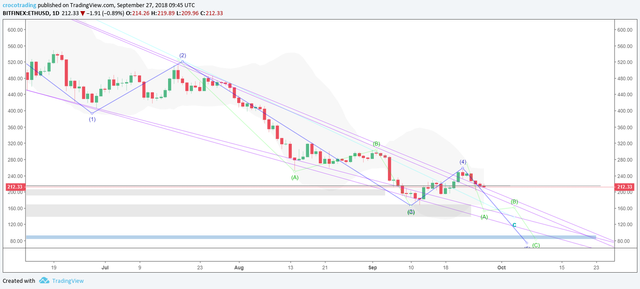
The first count (in orange) would mean wave 5 is done and therefore the long term correction is over. In the second count (in blue), there would still be one more wave down. A wave that would have a zigzag pattern (ABC).
The subcounts for the two scenarios I have in mind :
Please note that if we are in the blue count scenario, I have no idea where would the fifth wave ends without more datas and I have just draw it to the next demand zone for now.
Cons of the orange scenario:
- There was no big throw-over for wave 5 (see the ending diagonal link) and throw-overs usually happen with cryptos.
- The wave 4 hasn't touched the ending diagonal top line.
- The upside move after potentiel wave 5 wasn't violent enough
- Lots of volume (see bitfinex volume)
- Engulfing green candlesticks at the end of wave 5
- Quick bounce just on the top of the demand zone
- Price is already on the 100% extension line of wave A
- Price crossed the purple top lines of the ending diagonal and is holding above it
- Already lots of volume (even if we could see even more if we go down)
- Engulfin green candlesticks
- Other cryptocurrencies have already had their first bullish impulsive wave (see Ripple chart)
- Price is already on the 100% extension line of wave A
- Price crossed the purple top lines of the ending diagonal and is holding above it
- ABC of wave 3 for the blue scenario looks more logical
- Wave 4 of the orange scenario hasn't touched the ending diagonal top line
- The upside move we got (wave 4 for the blue scenario) from $160 to $250 looks like a simple ABC correction and not an impulsive wave (but it could be a leading diagonal)
- No big throw-over yet
My trading strategy
I am pretty confident in the fact that the bear market will soon be over. I have no idea on how the recovery phase will look like.
Usually, my scenarios have stop losses unless they are buy and hold (or sell and hold) scenarios which is the case here.
Currently, I have already bought ether for half of what I had plan to spend on it with an average entry price around $230.
I will keep the rest of my fiat in case the blue scenario comes to play. I plan to reinforce my position on different levels up to $50 in the worst case scenario.
It is too early to know where exactly I will sell my ether. For now, I don't plan to take any profits before $500 area and plan to keep most of them at least until $750-$850 but decisions will be taken in time according to my analysis of the price action. Why those take profit targets? TP1 is simply the first big resistance we will face. TP2 is also a huge resistance, a supply zone and the beginning of the ending diagonal which is usually the retracement target in the elliott wave theory.
I wouldn't recommand anyone to take a leveraged position on this trade nor to spend a too big size of his funds on a single trade. Even if the price looks really attractive, there is always a big risk that the price might drop to 0 or close to 0 without ever coming back to your entry level. No one know what the market will do.
Steemit : https://steemit.com/@focuscrypto
Tradingview : https://www.tradingview.com/u/crocotrading/
Facebook : https://www.facebook.com/crocotrading/
Twitter : https://twitter.com/crocotrading
Legal disclaimer : Opinions, markets informations, analyses and any statements made on crocotrading.com website constitute on no account investment advices. The information provided on this website and any accompanying material is for informational purposes only. It should not be considered financial or investment advice of any kind. One should consult with a financial or investment professional to determine what may be best for your individual needs.