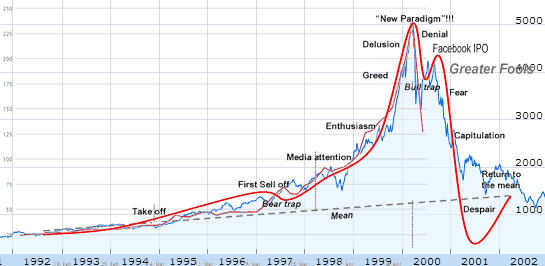
Bitcoin Bubble Graph Compared to DotCom Crash. Are we in Denial?

Red line: Bitcoin price
Red line (bold): Bubble
Blue line: DotCom crash
I figured I post this as it appears that we could be in the denial phase of a true bubble. If you look at the graph below Bitcoin appears to be following a similar trajectory. What do you think? Are you buying Bitcoin or have your stop limits set for a even bigger dip?
Hello friends, how are you
Thank you good friends to meet you
the best and amazing
Nice to Meet You All #steemians
My name is yusrizal Account name @rizal.aceh Comes from aceh Sumatra
I Say Welcome And Happy To You Here #steemit or # eSteem.
Do not Forget Follow Me Also @rizal.aceh
I would like to express my gratitude.
Congratulations @doityourself21! You have completed some achievement on Steemit and have been rewarded with new badge(s) :
Click on any badge to view your own Board of Honor on SteemitBoard.
For more information about SteemitBoard, click here
If you no longer want to receive notifications, reply to this comment with the word
STOPCongratulations @doityourself21! You have received a personal award!
Click on the badge to view your Board of Honor.
Do not miss the last post from @steemitboard:
Congratulations @doityourself21! You received a personal award!
You can view your badges on your Steem Board and compare to others on the Steem Ranking
Do not miss the last post from @steemitboard:
Vote for @Steemitboard as a witness to get one more award and increased upvotes!